Deconvolution#
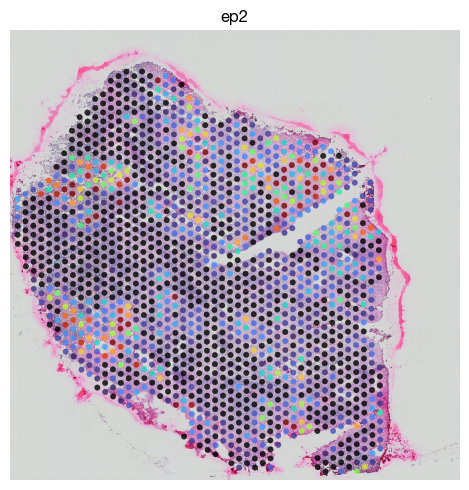
Spot-based spatial transcriptomics platforms measure gene expression at the tissue level, where each spot may contain a mixture of different cell types. Deconvolution methods infer the cellular composition of each spot by integrating single-cell RNA-seq reference data with the spatial expression profiles. This notebook demonstrates spatial deconvolution using the exprmat package with Tangram, a deep learning-based method that learns a spatial mapping from single-cell reference data to spatial coordinates. We cover the preparation of a single-cell reference dataset with cell type annotations, learning the spatial mapping matrix, projecting cell type abundances onto the tissue, and imputing gene expression to fill in genes not captured by the spatial assay.
[1]:
%load_ext autoreload
%autoreload 2
[2]:
import exprmat as em
em.setwd('../../../data')
ver = em.version()
[i] exprmat 0.2.66 / exprmat-db 0.2.66
[i] os: posix (linux)  platform version: 6.8.0-90-generic
[i] loaded configuration from /home/data/yangz/.exprmatrc
[i] current working directory: /home/data/yangz/packages/exprmat/data
[i] current database directory: /home/data/yangz/packages/database (0.2.66)
[i] resident memory: 776.46 MiB
[i] virtual memory: 5.95 GiB
[3]:
expm = em.load_experiment('expm/visium')
━━━━━━━━━━━━━━━━━━━━━━━━━━ loading samples 8 / 8 (00:03 < 00:00)
Visiummeasure gene expression across tissue spots, but they suffer from two key limitations: (i) limited gene coverage and (ii) spot-level resolution
Tangram addresses both issues through a two-step imputation approach:
Learning a spatial mapping (
tangram_map_cells) — A mapping matrix is learned that aligns single-cell RNA-seq reference cells (or clusters) to spatial spots, constrained by shared gene expression and optionally spatial density priors.Projecting gene expression (
tangram_project_genes) — Using the learned mapping, the full transcriptome of the single-cell reference is projected onto the spatial coordinates. This “imputes” expression for all genes (not just those captured by the spatial assay) at each spot, effectively filling in missing data and leveraging the high gene coverage of scRNA-seq.
First, we need a reference single cell RNA seq data of the same tissue origin to provide the insight of possible diversity of cells in the scenario. For the Visium detections for human HNSCC, we also use scRNA data of HNSCC. The data is already preprocessed to contain log normalized counts in .X
[4]:
sc = em.ad.read_h5ad('visium/single.h5ad')
Give a quick annotation, the process omitted.
[7]:
import exprmat.reader.rna as rna
rna.rna_leiden(sc, None, None, resolution = 1.0)

mapping = {
    'Epi1': ['2', '8'],
    'Epi2': ['14', '19', '7', '9', '15'],
    'Fib': ['13'],
    'SMC': ['4', '3', '22'],
    'Ma': ['17'],
    'Mye': ['20'],
    'Neu': ['16'],
    'T4': ['5', '6'],
    'T8': ['10'],
    'Pl': ['18'],
    'LE': ['21'],
    'EC': ['0', '1', '12', '23'],
    'B': ['11']
}

revmap = {}
for k, v in mapping.items():
    for x in v: revmap[x] = k

sc.obs['cell.type'] = [revmap[x] for x in sc.obs['leiden']]
sc.obs['cell.type'] = sc.obs['cell.type'].astype('category')
fig = rna.rna_plot_embedding(
    sc, None, None,
    basis = 'umap', color = 'cell.type',
    legend = False, annotate_style = 'text'
)
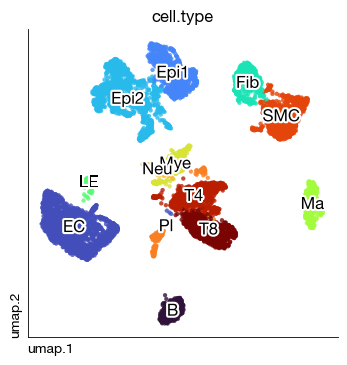
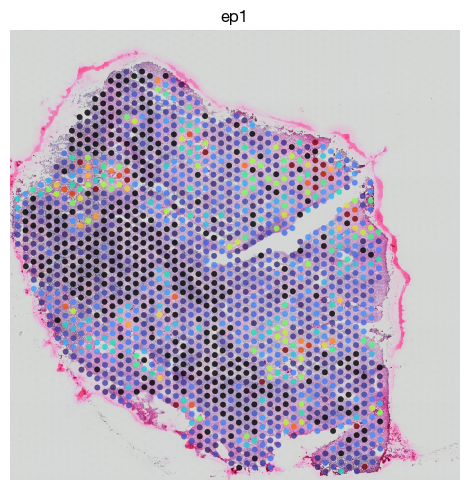
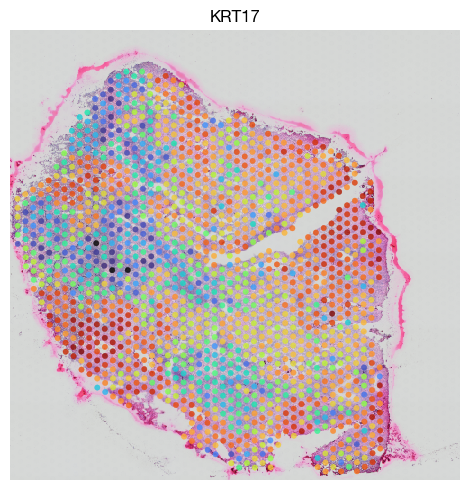
For example, we identified two epithelial components (One KRT17+ TP63+, and the other KRT8+ EPCAM+). We want to find mappings of these two subset into spatial coordinates and morphology.
[13]:
fig = rna.rna_plot_multiple_embedding(
    sc, None, None, ncols = 3, figsize = (9, 3),
    basis = 'umap', features = ['KRT17', 'TP63', 'EPCAM'],
    legend = False, annotate_style = 'text'
)
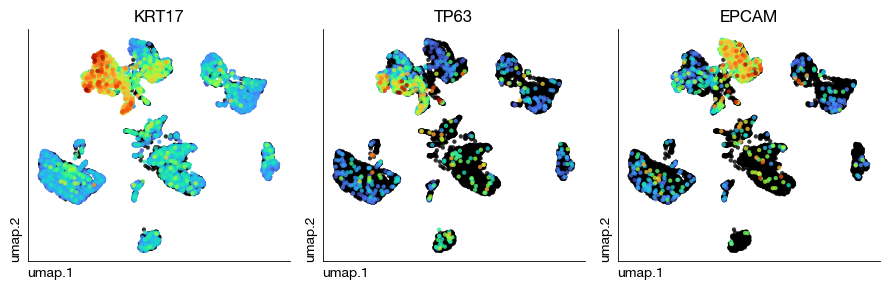
For the building of spatial mappings, we use spatially variable genes merged from all clusters.
[ ]:
sample = 'p2-t5'
expm.spatial_bin.get_markers(
    run_on_samples = [sample],
    slot = 'spagcn.markers',
    group_name = '17'
)[sample][['gene', 'pct.in', 'pct.out', 'fc', 'q', 'log10.q']]
[i] fetched diff `17` over `rest` (18 genes)
| gene | pct.in | pct.out | fc | q | log10.q | |
|---|---|---|---|---|---|---|
| rna:hsa:g13826 | LUM | 1.000000 | 0.996835 | 2.302415 | 6.437318e-78 | 77.191295 |
| rna:hsa:g22861 | HERPUD1 | 0.997691 | 0.995253 | 2.107135 | 6.339839e-77 | 76.197922 |
| rna:hsa:g53680 | SFRP4 | 0.852194 | 0.485759 | 2.073682 | 2.236636e-110 | 109.650405 |
| rna:hsa:g15444 | POSTN | 0.946882 | 0.783228 | 1.945651 | 3.066666e-95 | 94.513333 |
| rna:hsa:g57703 | TP53INP1 | 0.997691 | 0.992089 | 1.802479 | 7.859763e-72 | 71.104591 |
| rna:hsa:g59915 | ASPN | 0.967667 | 0.799051 | 1.755815 | 1.035827e-91 | 90.984713 |
| rna:hsa:g57902 | CTHRC1 | 0.963048 | 0.806962 | 1.665744 | 3.148795e-84 | 83.501856 |
| rna:hsa:g6228 | VIM | 1.000000 | 0.995253 | 1.655484 | 1.246817e-58 | 57.904197 |
| rna:hsa:g4692 | BTG2 | 0.997691 | 0.995253 | 1.605542 | 1.204427e-58 | 57.919219 |
| rna:hsa:g62036 | PIM2 | 0.995381 | 0.985759 | 1.579871 | 1.728512e-58 | 57.762328 |
| rna:hsa:g45757 | SFRP2 | 0.933025 | 0.912975 | 1.579464 | 7.928045e-74 | 73.100834 |
| rna:hsa:g35422 | IGFBP5 | 0.956120 | 0.943038 | 1.578879 | 2.130125e-68 | 67.671595 |
| rna:hsa:g58420 | PTP4A3 | 1.000000 | 0.985759 | 1.565828 | 1.001160e-74 | 73.999496 |
| rna:hsa:g39969 | FBLN1 | 0.935335 | 0.881329 | 1.562546 | 6.522984e-76 | 75.185554 |
| rna:hsa:g52137 | CCN2 | 0.995381 | 0.988924 | 1.557651 | 3.224739e-44 | 43.491505 |
| rna:hsa:g35923 | COL6A3 | 0.990762 | 0.973101 | 1.552273 | 5.541407e-72 | 71.256380 |
| rna:hsa:g44744 | CXCL13 | 0.956120 | 0.941456 | 1.518375 | 1.463188e-57 | 56.834700 |
| rna:hsa:g34966 | COL5A2 | 0.997691 | 0.977848 | 1.515412 | 1.668277e-65 | 64.777732 |
[15]:
clusters = ['7', '17', '18', '19', '20', '21']
genes = []
for c in clusters:
    # get marker genes
    genes += expm.spatial_bin.get_markers(
        run_on_samples = [sample],
        slot = 'spagcn.markers',
        group_name = c
    )[sample].index.tolist()

genes = list(set(genes))
[i] fetched diff `7` over `rest` (0 genes)
[i] fetched diff `17` over `rest` (18 genes)
[i] fetched diff `18` over `rest` (9 genes)
[i] fetched diff `19` over `rest` (35 genes)
[i] fetched diff `20` over `rest` (54 genes)
[i] fetched diff `21` over `rest` (104 genes)
[18]:
expm.spatial_bin.view(sample)
annotated data of size 1470 × 35554
    obs : sample <cat> batch <cat> group <cat> modality <cat> taxa <cat> barcode <o> ubc <o>
          in.tissue <i64> row <i64> col <i64> y <i64> x <i64> leiden <cat> spagcn.domain <cat>
          spagcn.refined <cat> imagerow <f64> imagecol <f64> deepst.domain <cat>
          deepst.refined <cat> integrated <cat> metagene.17 <f64>
    var : chr <cat> start <i64> end <i64> strand <cat> id <o> subtype <cat> gene <cat> tlen <f64>
          cdslen <i64> assembly <cat> uid <o> vst.means <f64> vst.vars <f64> vst.vars.norm <f64>
          vst.hvg.rank <f32> vst.hvg <bool> spatialde.padj <f64> spatialde.svg <bool>
          spatialde.rank <f64>
 layers : counts <f32> lognorm <f32> norm <f32>
   obsm : adjacent <arr:f64(35554)> augmented.genes <arr:f64(35554)> deepst.embedding <arr:f32(28)>
          knn <arr:i32(30)> knn.d <arr:f64(30)> pca <arr:f64(35)> spatial <arr:i64(2)>
          spatial.array <arr:i64(2)> umap <arr:f32(2)> weights <arr:f64>
   varm : pca <arr:f64(35)>
   obsp : connectivities <csr:f32> distances <csr:f64>
    uns : deepst.domain leiden neighbors pca spagcn.markers spatial umap
[25]:
expm.spatial_bin.tangram_map(
    run_on_samples = [sample],
    adata_sc = sc, # the scrna reference.
    genes = genes, # spatially variable genes to use.
    mode = 'clusters', # use cluster-level mapping.
    cluster_label = 'cell.type',
    device = 'cuda',
    random_state = 42,
    verbose = True,
    density_prior = 'rna_count_based',
    key_added = 'tangram',
    layer = 'counts'
)
[i] 216 training genes saved to uns["training_genes"].
[i] 18353 overlapping genes saved to uns["overlap_genes"].
[i] uniform density prior saved to obs["uniform_density"].
[i] rna-count based density prior saved to obs["rna_count_based_density"].
[i] allocating tensors for mapping.
[i] training with 216 genes, density prior rna_count_based, mode clusters.
[i] printing scores every 100 epochs.
[i] gene-voxel score: 0.315, cell densities reg: 0.378
[i] gene-voxel score: 0.637, cell densities reg: 0.012
[i] gene-voxel score: 0.639, cell densities reg: 0.011
[i] gene-voxel score: 0.640, cell densities reg: 0.011
[i] gene-voxel score: 0.640, cell densities reg: 0.011
[i] gene-voxel score: 0.640, cell densities reg: 0.011
[i] gene-voxel score: 0.640, cell densities reg: 0.011
[i] gene-voxel score: 0.640, cell densities reg: 0.011
[i] gene-voxel score: 0.640, cell densities reg: 0.011
[i] gene-voxel score: 0.641, cell densities reg: 0.011
[i] saving results.
[28]:
expm.spatial_bin[sample].obsm['tangram'].iloc[:, :4]
[28]:
| EC | Epi2 | T4 | SMC | |
|---|---|---|---|---|
| p2-t5:1 | 0.000413 | 0.000008 | 0.002090 | 1.661525e-05 |
| p2-t5:2 | 0.000003 | 0.000002 | 0.000001 | 1.645054e-03 |
| p2-t5:3 | 0.000376 | 0.001533 | 0.000006 | 1.243685e-06 |
| p2-t5:4 | 0.001505 | 0.001084 | 0.000135 | 1.841247e-07 |
| p2-t5:5 | 0.000211 | 0.000463 | 0.000003 | 5.065746e-06 |
| ... | ... | ... | ... | ... |
| p2-t5:1466 | 0.000092 | 0.000046 | 0.000009 | 2.760589e-06 |
| p2-t5:1467 | 0.001473 | 0.000005 | 0.003435 | 1.010608e-03 |
| p2-t5:1468 | 0.000674 | 0.000010 | 0.000149 | 8.719371e-04 |
| p2-t5:1469 | 0.000284 | 0.000086 | 0.001662 | 2.218365e-04 |
| p2-t5:1470 | 0.001869 | 0.000451 | 0.000011 | 3.911006e-06 |
1470 rows × 4 columns
[30]:
expm.spatial_bin[sample].obs['ep1'] = expm.spatial_bin[sample].obsm['tangram']['Epi1']
expm.spatial_bin[sample].obs['ep2'] = expm.spatial_bin[sample].obsm['tangram']['Epi2']
[40]:
fig = expm.spatial_bin.plot_spatial(
    run_on_samples = [sample],
    channels = ['hires/r', 'hires/g', 'hires/b'],
    plot_embeddings = {
        'visible': True,
        'basis': 'spatial',
        'color': 'ep1',
        'ptsize': 15,
        'annotate_style': 'text',
        'vmax': 0.005,
    },
    xrange = (3000, 13000),
    yrange = (5000, 15000),
    figsize = (5, 5),
)
[36]:
fig = expm.spatial_bin.plot_spatial(
    run_on_samples = [sample],
    channels = ['hires/r', 'hires/g', 'hires/b'],
    plot_embeddings = {
        'visible': True,
        'basis': 'spatial',
        'color': 'KRT17',
        'ptsize': 15,
        'annotate_style': 'text'
    },
    xrange = (3000, 13000),
    yrange = (5000, 15000),
    figsize = (5, 5)
)
[41]:
fig = expm.spatial_bin.plot_spatial(
    run_on_samples = [sample],
    channels = ['hires/r', 'hires/g', 'hires/b'],
    plot_embeddings = {
        'visible': True,
        'basis': 'spatial',
        'color': 'ep2',
        'ptsize': 15,
        'annotate_style': 'text',
        'vmax': 0.005,
    },
    xrange = (3000, 13000),
    yrange = (5000, 15000),
    figsize = (5, 5)
)
Imputation#
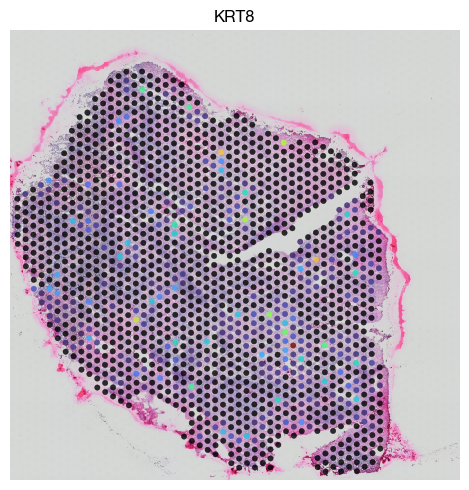
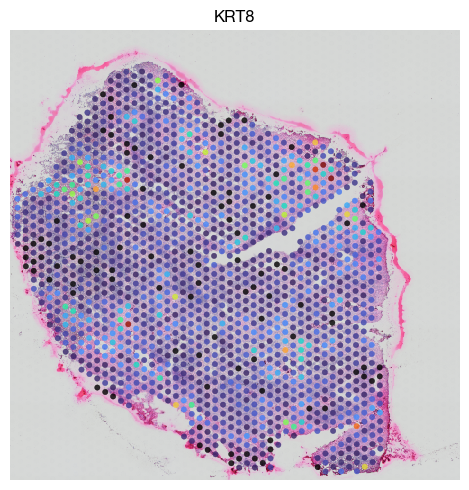
Using paired single-cell data, we can impute the expression matrices to rule out the extensive sparsity of spatial techniques.
[42]:
expm.spatial_bin.tangram_impute(
    run_on_samples = [sample],
    adata_sc = sc,
    cluster_label = 'cell.type',
    scale = True,
    map_key = 'tangram',
    layer = 'imputed'
)
KRT8 expression before imputation
[43]:
fig = expm.spatial_bin.plot_spatial(
    run_on_samples = [sample],
    channels = ['hires/r', 'hires/g', 'hires/b'],
    plot_embeddings = {
        'visible': True,
        'basis': 'spatial',
        'color': 'KRT8',
        'ptsize': 15,
        'annotate_style': 'text'
    },
    xrange = (3000, 13000),
    yrange = (5000, 15000),
    figsize = (5, 5)
)
KRT8 expression after imputation
[44]:
fig = expm.spatial_bin.plot_spatial(
    run_on_samples = [sample],
    channels = ['hires/r', 'hires/g', 'hires/b'],
    plot_embeddings = {
        'visible': True,
        'basis': 'spatial',
        'slot': 'imputed',
        'color': 'KRT8',
        'ptsize': 15,
        'annotate_style': 'text'
    },
    xrange = (3000, 13000),
    yrange = (5000, 15000),
    figsize = (5, 5)
)
[45]:
expm.spatial_bin.view(sample)
annotated data of size 1470 × 35554
    obs : sample <cat> batch <cat> group <cat> modality <cat> taxa <cat> barcode <o> ubc <o>
          in.tissue <i64> row <i64> col <i64> y <i64> x <i64> leiden <cat> spagcn.domain <cat>
          spagcn.refined <cat> imagerow <f64> imagecol <f64> deepst.domain <cat>
          deepst.refined <cat> integrated <cat> metagene.17 <f64> ep1 <f32> ep2 <f32>
    var : chr <cat> start <i64> end <i64> strand <cat> id <o> subtype <cat> gene <cat> tlen <f64>
          cdslen <i64> assembly <cat> uid <o> vst.means <f64> vst.vars <f64> vst.vars.norm <f64>
          vst.hvg.rank <f32> vst.hvg <bool> spatialde.padj <f64> spatialde.svg <bool>
          spatialde.rank <f64>
 layers : counts <f32> lognorm <f32> norm <f32> imputed <f32>
   obsm : adjacent <arr:f64(35554)> augmented.genes <arr:f64(35554)> deepst.embedding <arr:f32(28)>
          knn <arr:i32(30)> knn.d <arr:f64(30)> pca <arr:f64(35)> spatial <arr:i64(2)>
          spatial.array <arr:i64(2)> umap <arr:f32(2)> weights <arr:f64> tangram <df>
   varm : pca <arr:f64(35)>
   obsp : connectivities <csr:f32> distances <csr:f64>
    uns : deepst.domain leiden neighbors pca spagcn.markers spatial umap tangram
[46]:
expm.save()
[i] main dataset write to expm/visium/integrated.h5mu
[i] saving individual samples. (pass `save_samples = False` to skip)
━━━━━━━━━━━━━━━━━━━━━━━━ modality [spatial-bin] 8 / 8 (00:08 < 00:00)