Gene network module#
For bulk or pseudobulk samples, shared co-expression modules for genes can be derived. Genes expression are commonly internally correlated, reflecting genomic modules that derives specific function cooperations.
WGCNA help cluster genes by expression correlations, and derives gene modules that tend to vary within samples. Commonly, to capture enough variability, at least 15 bulk samples is required to obtain robust and sensible result.
[1]:
%load_ext autoreload
%autoreload 2
[2]:
import exprmat as em
# set working directory
em.setwd('../../../data')
ver = em.version()
[i] exprmat 0.2.66 / exprmat-db 0.2.66
[i] os: posix (linux)  platform version: 6.8.0-90-generic
[i] loaded configuration from /home/data/yangz/.exprmatrc
[i] current working directory: /home/data/yangz/packages/exprmat/data
[i] current database directory: /home/data/yangz/packages/database (0.2.66)
[i] resident memory: 778.72 MiB
[i] virtual memory: 5.95 GiB
We will use the pseudo-bulk samples for WGCNA
[3]:
expm = em.load_experiment('expm/scrna', load_samples = True, load_subset = 'mono-neutro')
━━━━━━━━━━━━━━━━━━━━━━━━━━ loading samples 5 / 5 (00:05 < 00:00)
[4]:
print(expm)
annotated data of size 9754 × 19651
subset mono-neutro of size 9754 × 19651
contains modalities: rna

 modality [rna]
    obs : sample <cat> <c/sample> batch <cat> <c/batch> group <cat> <c> modality <cat> <c/modality>
          taxa <cat> <c/taxa> barcode <o> <o> ubc <o> <o> n.umi <f64> <i> n.genes <i64> <i>
          n.mito <f64> <f> n.ribo <f64> <f> pct.mito <f64> <f> pct.ribo <f64> <f>
          filter <bool> <bool> score.doublet <f64> <f> score.doublet.se <f64> <f>
          is.doublet <bool> <bool> qc <bool> <bool/qc> leiden <cat> <c> sc3.5 <cat> <c>
          sc3.10 <cat> <c> sc3.20 <cat> <c> sc3.30 <cat> <c> cell.type <cat> <c>
          kde.umap <f64> <f/kde> psbulk <cat> <o> cytotrace.score <f64> <f>
          cytotrace.potency <cat> <o> cytotrace.relative <f64> <f> cytotrace.score.preknn <f64> <f>
          cytotrace.potency.preknn <cat> <o> ppt.pseudotime <f64> <f> ppt.seg <cat> <o>
          ppt.edge <cat> <o> ppt.milestones <cat> <o>
    var : chr <cat> <c/chromosome> start <i64> <i> end <i64> <i> strand <cat> <c/strand> id <o> <o>
          subtype <cat> <c/gsubtype> gene <cat> <o/gene> tlen <f64> <i/tlen> cdslen <i64> <i/cdslen>
          assembly <cat> <c> uid <o> <o/ugene> vst.hvg <bool> <bool/hvg> vst.all.means <f64> <f>
          vst.all.vars <f64> <f> vst.all.vars.norm <f64> <f> vst.all.hvg.rank <f32> <f>
          vst.all.hvg <bool> <bool>
 layers : counts <f32> <i/counts> magic <f64> <f/normal/imputed> norm <f32> <f>
   obsm : cnmf.10 <df> <f/embedding/usage> diffmap <arr:f32(5)> <f/embedding>
          harmony <arr:f32(35)> <f> knn <arr:i32(100)> <i/knni> knn.d <arr:f32(100)> <f/knnd>
          knn.d.nn30.diffmap <arr:f32(30)> <f> knn.nn30.diffmap <arr:i32(30)> <i>
          pca <arr:f64(35)> <f/embedding/pca> ppt <arr:f64(2000)> <ppt-assign>
          umap <arr:f32(2)> <f/embedding> umap.diff <arr:f32(2)> <f/embedding>
   varm : cnmf.10 <arr:f64(10)> <f/weights> cnmf.coef.10 <arr:f64(10)> <f/usage-coef>
          pca <arr:f64(35)> <f/weights>
   obsp : connectivities <csr:f32> <f/connectivity> connectivities.nn30.diffmap <csr:f32> <f>
          distances <csr:f32> <f/distance> distances.nn30.diffmap <csr:f32> <f>
    uns : cell.type.colors <o> cell.type_colors <o> cnmf <cnmf> cnmf.args <o>
          cnmf.density.10 <cnmf-density> cnmf.dist.10 <f/connectivity> cnmf.stats <cnmf-stats>
          commands <system> diffmap <o> kde.umap <kde-stats> leiden <o> leiden.colors <o>
          magic.errors <magic-errors> magic.t <magic-t> markers <markers> neighbors <knn>
          nn30.diffmap <knn> pca <dict> ppt <ppt> ppt.graph <o> ppt.milestones.colors <o>
          ppt.pseudotime <o> ppt.root <i> ppt.seg.colors <o> sc3.10.colors <o> sc3.20.colors <o>
          sc3.30.colors <o> sc3.5.colors <o> slots <system> trace <trace> umap <o> umap.diff <o>

[*] composed of samples:
  distal                rna   mmu    batch b1        of size 6451 × 21689
  niche                 rna   mmu    batch b2        of size 3656 × 21970
  normal                rna   mmu    batch b3        of size 4537 × 21917
  integrated-metacell   rna   autogen   batch autogen   of size 1277 × 18903
  psbulk                rna   autogen   batch autogen   of size 18 × 8928
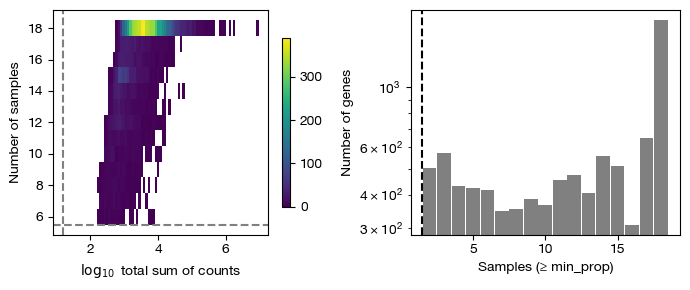
The pseudobulk matrix has already been filtered. See Statistics vignitte for details
[5]:
fig = expm.rna.plot_pseudobulk_features(
    run_on_samples = ['psbulk'],
    group = 'group',
    lib_size = None,
    min_count = 10,
    min_total_count = 15,
    large_n = 10,
    min_sample_prop = 0.7,
    cmap = 'viridis',
    min_cell_prop = 0.2,
    min_samples = 2,
    figsize = (7, 3),
    dpi = 100
)
[7]:
expm.rna.log_normalize(run_on_samples = ['psbulk'])
[8]:
expm.rna.view('psbulk')
annotated data of size 18 × 8928
    obs : cell.type <cat> <c> sample <cat> <c/sample> group <cat> <c> counts <f32> <f>
          cells <i64> <i>
    var : chr <cat> <c/chromosome> start <i64> <i> end <i64> <i> strand <cat> <c/strand> id <o> <o>
          subtype <cat> <c/gsubtype> gene <cat> <o/gene> tlen <f64> <i/tlen> cdslen <i64> <i/cdslen>
          assembly <cat> <c> uid <o> <o/ugene> vst.hvg <bool> <bool/hvg> vst.all.means <f64> <f>
          vst.all.vars <f64> <f> vst.all.vars.norm <f64> <f> vst.all.hvg.rank <f32> <f>
          vst.all.hvg <bool> <bool>
 layers : proportions <f64> <f/proportions> norm <f32> <f/linear> lognorm <f32> <f/normal>
          counts <f32> <i/counts>
    uns : commands <system> slots <system>
WGCNA should be run on log normalized data
[10]:
fig = expm.rna.plot_wgcna_soft_threshold(
    run_on_samples = ['psbulk'],
    layer = None,
)
[i] soft-thresholding power = 16 (scale-free r^2 cutoff met).
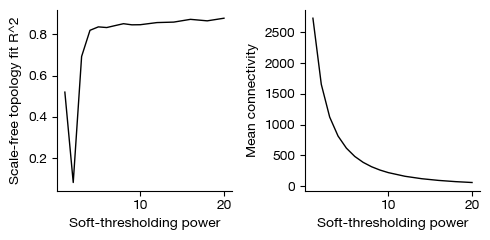
Select the power for WGCNA, if left empty, it will automatically inferred.
[11]:
expm.rna.wgcna(
    run_on_samples = ['psbulk'],
    layer = None, key_added = 'wgcna',
    power = 6
)
[i] preparing expression matrix...
[i] using user-specified soft-thresholding power = 6.
[i] computing adjacency matrix...
[i] computing topological overlap matrix...
[i] hierarchical clustering of (1 - tom)...
[i] dynamic hybrid tree cut (min_module_size = 30, deep_split = 2)...
[i] initial modules = 50 (plus 2853 unassigned).
[i] merging modules with eigengene dissimilarity < 0.25...
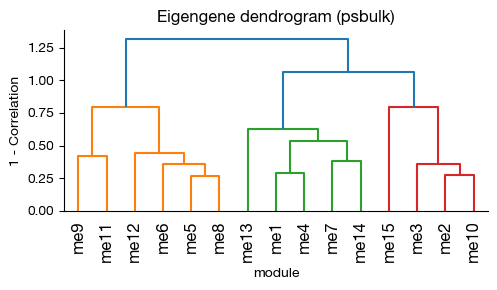
[i] final modules = 15.
[12]:
fig = expm.rna.plot_wgcna_eigengene_dendrogram(
    run_on_samples = ['psbulk'],
    key_added = 'wgcna',
    method = 'pearson',
    cmap = 'viridis',
    figsize = (5, 3),
    dpi = 100
)
[14]:
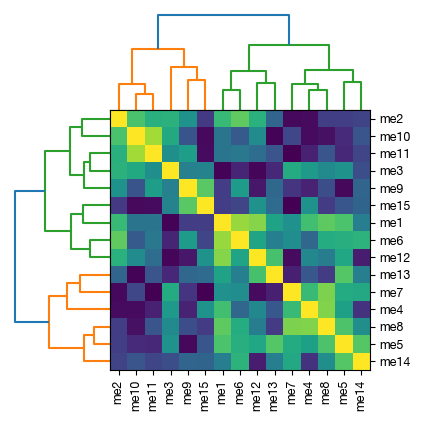
fig = expm.rna.plot_wgcna_eigengene_adjacency_heatmap(
    run_on_samples = ['psbulk'],
    key_added = 'wgcna',
    method = 'pearson',
    cmap = 'viridis',
    figsize = (4, 4),
    dpi = 100
)
[16]:
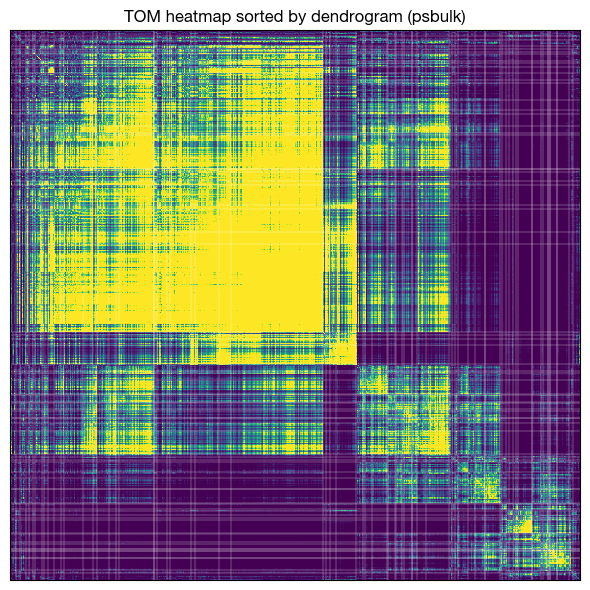
fig = expm.rna.plot_wgcna_tom_heatmap(
    run_on_samples = ['psbulk'],
    key_added = 'wgcna',
    layer = None,
    power = 5,
    network_type = 'signed hybrid',
    tom_type = 'signed', tom_denom = 'min',
    show_module_boundaries = True,
    boundary_color = 'white',
    boundary_linewidth = 0.2,
    cmap = 'viridis',
    vmin = 0.0, vmax = 0.25,
    figsize = (6.0, 6.0), dpi = 100,
)
[!] tom matrix was not found in adata.uns; recomputing from expression.
[17]:
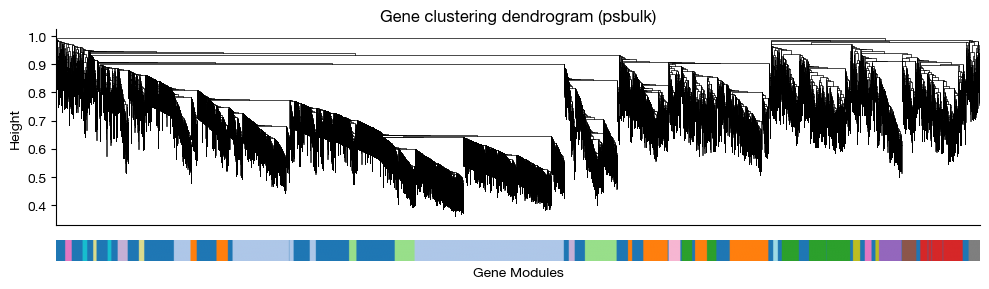
fig = expm.rna.plot_wgcna_gene_dendrogram(
    run_on_samples = ['psbulk'],
    key_added = 'wgcna',
    linewidth = 0.5,
    figsize = (10.0, 3.0),
    dpi = 100,
)
[26]:
expm.save()
[i] main dataset write to expm/scrna/subsets/mono-neutro.h5mu
[i] saving individual samples. (pass `save_samples = False` to skip)
━━━━━━━━━━━━━━━━━━━━━━━━━━ modality [rna] 5 / 5 (00:01 < 00:00)