Immune Repertoire Tracing#
T-cell receptors (TCRs) and B-cell receptors (BCRs) are generated through somatic recombination of V(D)J gene segments, producing an immensely diverse repertoire of antigen-specific receptors. Single-cell RNA-seq data can simultaneously capture both the transcriptome and the immune receptor sequences from individual lymphocytes, enabling the tracing of clonal lineages and the linking of clonotype identity to functional state. This notebook demonstrates immune repertoire analysis using the exprmat package, covering the integration of TCR/BCR sequencing data with gene expression profiles, clonotype clustering, analysis of clonal expansion, and characterization of the transcriptional programs associated with specific clonal lineages.
[1]:
%load_ext autoreload
%autoreload 2
[2]:
import exprmat as em
# set working directory
em.setwd('../../../data')
ver = em.version()
[i] exprmat 0.2.66 / exprmat-db 0.2.66
[i] os: posix (linux)  platform version: 6.8.0-90-generic
[i] loaded configuration from /home/data/yangz/.exprmatrc
[i] current working directory: /home/data/yangz/packages/exprmat/data
[i] current database directory: /home/data/yangz/packages/database (0.2.66)
[i] resident memory: 777.80 MiB
[i] virtual memory: 5.95 GiB
We need two sets of data from the 10X pipeline: the corresponding RNA sequencing data, and the secondary data table filtered_contig_annotations.csv.
[4]:
! eza --group-directories-first --tree --long scrna/pbmc-tcr
drwxr-x---    - yangz  4 May 10:09 scrna/pbmc-tcr
drwxr-x---    - yangz  4 May 10:09 ├── rna
.rw-r-----  64k yangz  4 May 10:09 │  ├── barcodes.tsv.gz
.rw-r----- 342k yangz  4 May 10:09 │  ├── features.tsv.gz
.rw-r----- 101M yangz  4 May 10:09 │  └── matrix.mtx.gz
drwxr-x---    - yangz  4 May 10:09 └── tcr
.rw-r-----  35M yangz  4 May 10:09    ├── airr_rearrangement.tsv
.rw-r----- 182k yangz  4 May 10:09    ├── cell_barcodes.json
.rw-r----- 898k yangz  4 May 10:09    ├── clonotypes.csv
.rw-r----- 2.1M yangz  4 May 10:09    ├── concat_ref.bam
.rw-r----- 790k yangz  4 May 10:09    ├── concat_ref.bam.bai
.rw-r----- 9.8M yangz  4 May 10:09    ├── concat_ref.fasta
.rw-r----- 547k yangz  4 May 10:09    ├── concat_ref.fasta.fai
.rw-r----- 1.5M yangz  4 May 10:09    ├── consensus.bam
.rw-r----- 790k yangz  4 May 10:09    ├── consensus.bam.bai
.rw-r----- 5.6M yangz  4 May 10:09    ├── consensus.fasta
.rw-r----- 529k yangz  4 May 10:09    ├── consensus.fasta.fai
.rw-r----- 6.4M yangz  4 May 10:09    ├── consensus_annotations.csv
.rw-r-----  14k yangz  4 May 10:09    ├── donor_regions.fa
.rw-r----- 8.1M yangz  4 May 10:09    ├── filtered_contig.fasta
.rw-r-----  16M yangz  4 May 10:09    ├── filtered_contig.fastq
.rw-r----- 9.0M yangz  4 May 10:09    └── filtered_contig_annotations.csv
[8]:
meta = em.metadata(
    locations    = [
        'scrna/pbmc-tcr/rna',
        'scrna/pbmc-tcr/tcr',
    ],
    modality     = ['rna', 'rna/tcr'],
    default_taxa = ['hsa', 'hsa'],
    batches      = ['b-1', 'b-1'],
    names        = ['pbmc', 'pbmc'],
    groups       = ['pbmc', 'pbmc'],
)
[6]:
meta.dataframe
[6]:
| location | sample | batch | group | modality | taxa | |
|---|---|---|---|---|---|---|
| 0 | scrna/pbmc-tcr/rna | pbmc | b-1 | pbmc | rna | hsa |
| 1 | scrna/pbmc-tcr/tcr | pbmc | b-1 | pbmc | rna/tcr | hsa |
[9]:
expm = em.experiment(meta, dump = 'expm/tcr')
[i] reading sample pbmc [rna] ...
[i] 958 genes (out of 38606) not in the reference gene list.
[i] total 37648 genes mapped. 37557 unique genes.
[i] reading sample pbmc [rna/tcr] ...
Currently, the TCR table has not been added to the dataset. The lookup and integration of TCR-matched cells occurs in the merge function.
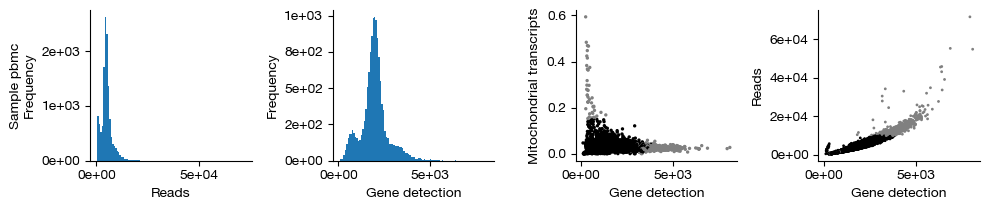
Quality Control and Visualization#
We first perform basic cleaning of the dataset.
[10]:
expm.rna.qc(
    run_on_samples = True,
    mt_seqid = 'chrM',
    mt_percent = 0.15,
    ribo_genes = None,
    ribo_percent = None,
    outlier_mode = 'mads',
    outlier_n = 5,
    doublet_method = 'no',
    min_cells = 3,
    min_genes = 50
)
[i] found 13 mitochondrial genes (expected 13)
[i] found 102 ribosomal genes
quality controlling sample [pbmc] ...
raw dataset contains 13409 cells, 26253 genes
filtered dataset contains 12641 cells, 22325 genes
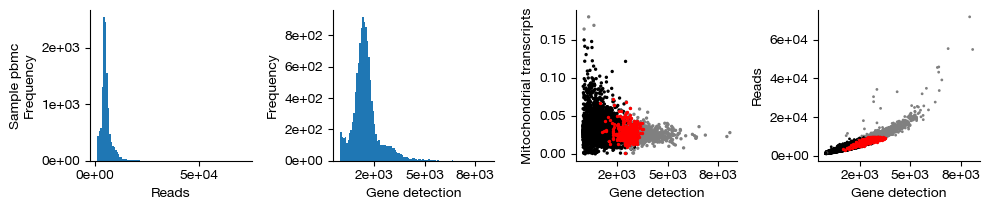
[11]:
figs = expm.rna.plot_qc(run_on_samples = True)
[12]:
expm.rna.qc(
    run_on_samples = True,
    mt_seqid = 'chrM',
    mt_percent = 0.15,
    ribo_genes = None,
    ribo_percent = None,
    outlier_mode = 'mads',
    outlier_n = 5,
    doublet_method = 'scrublet',
    min_cells = 3,
    min_genes = 800
)
[i] found 13 mitochondrial genes (expected 13)
[i] found 102 ribosomal genes
quality controlling sample [pbmc] ...
raw dataset contains 13409 cells, 26253 genes
[i] preprocessing observation count matrix ...
[i] simulating doublets ...
[i] embedding using pca ...
[i] calculating doublet scores ...
[i] detected doublet rate: 3.7 %
[i] estimated detectable doublet fraction: 80.5 %
[i] overall doublet rate: 4.6 %
filtered dataset contains 11229 cells, 22165 genes
[13]:
figs = expm.rna.plot_qc(run_on_samples = True)
[14]:
expm.rna.filter(run_on_samples = True)
[15]:
expm.rna.log_normalize(
    run_on_samples = True,
    key_norm = 'norm',
    key_lognorm = 'lognorm'
)

expm.rna.select_hvg(
    run_on_samples = True,
    key_lognorm = 'lognorm',
    method = 'vst',
    dest = 'vst',
    n_top_genes = 1500
)

expm.merge(join = 'outer')
[i] reading tcr table from expm/tcr/tcr/pbmc.tsv.gz ...
[!] tcr table contains 1289 duplicated contigs for one cell.
[!] 5463 out of 6154 (88.8%) tcr detections mapped.
[i] 11229 out of 11229 (100.0%) tcr detections mapped.
During the integration process, the TCR dataset is automatically loaded and matched to the corresponding cells, populating the obs columns.
[16]:
print(expm)
annotated data of size 11229 × 22165
integrated dataset of size 11229 × 22165
contains modalities: rna

 modality [rna]
    obs : sample <cat> <c/sample> batch <cat> <c/batch> group <cat> <c> modality <cat> <c/modality>
          taxa <cat> <c/taxa> barcode <o> <o> ubc <o> <o> n.umi <f64> <i> n.genes <i64> <i>
          n.mito <f64> <f> n.ribo <f64> <f> pct.mito <f64> <f> pct.ribo <f64> <f>
          filter <bool> <bool> score.doublet <f64> <f> score.doublet.se <f64> <f>
          is.doublet <bool> <bool> qc <bool> <bool/qc> tra <o> trb <o> clone <o> clone.id <o>
          trav <o> traj <o> trbv <o> trbj <o>
    var : chr <o> <c/chromosome> start <i64> <i> end <i64> <i> strand <o> <c/strand> id <o> <o>
          subtype <o> <c/gsubtype> gene <o> <o/gene> tlen <f64> <i/tlen> cdslen <i64> <i/cdslen>
          assembly <o> <c> uid <o> <o/ugene>
 layers : counts <f32> <i/counts>
    uns : slots <system>

[*] composed of samples:
  pbmc    rna   hsa    batch b-1     of size 11229 × 22165
[17]:
expm['rna'].obs[['clone.id', 'trav', 'traj', 'trbv', 'trbj']]
[17]:
| clone.id | trav | traj | trbv | trbj | |
|---|---|---|---|---|---|
| pbmc:2 | pbmc:c:1 | TRAV21 | TRAJ41 | TRBV11-1 | TRBJ2-2 |
| pbmc:3 | pbmc:c:2 | TRAV19 | TRAJ17 | TRBV20-1 | TRBJ2-7 |
| pbmc:4 | na | na | na | na | na |
| pbmc:5 | pbmc:c:3 | TRAV38-2/DV8 | TRAJ53 | TRBV5-1 | TRBJ1-4 |
| pbmc:6 | pbmc:c:4 | TRAV14/DV4 | TRAJ54 | TRBV2 | TRBJ2-3 |
| ... | ... | ... | ... | ... | ... |
| pbmc:13403 | pbmc:c:5132 | TRAV8-4 | TRAJ26 | TRBV2 | TRBJ2-2 |
| pbmc:13404 | na | na | na | na | na |
| pbmc:13407 | na | na | na | na | na |
| pbmc:13408 | na | na | na | na | na |
| pbmc:13409 | pbmc:c:5133 | TRAV26-1 | TRAJ32 | TRBV10-3 | TRBJ2-6 |
11229 rows × 5 columns
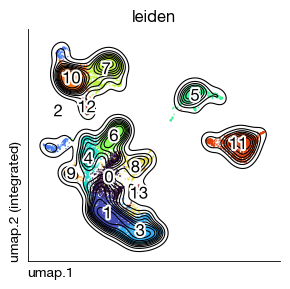
Dimensionality Reduction and Clustering#
We use conventional methods for dimensionality reduction of the 5’ data. Because 5’ sequencing captures immunoglobulin gene diversity, we choose to exclude these genes during dimensionality reduction to prevent different clones from clustering separately.
[18]:
expm.rna.select_hvg(
    key_lognorm = 'X',
    method = 'vst',
    dest = 'vst',
    batch_key = 'batch',
    n_top_genes = 1500
)

expm.rna.scale_pca(
    hvg = 'vst.hvg',
    key_lognorm = 'X',
    key_scaled = 'scaled',
    key_added = 'pca', n_comps = 35,
    keep_sparse = False,
    random_state = 42,
    svd_solver = 'arpack'
)

expm.rna.knn(
    use_rep = 'pca',
    n_comps = None,
    n_neighbors = 30,
    knn = True,
    method = "umap",
    transformer = None,
    metric = "euclidean",
    metric_kwds = {},
    random_state = 42,
    key_added = 'nn30'
)

expm.rna.umap(
    min_dist = 0.3,
    spread = 1,
    n_components = 2,
    maxiter = None,
    alpha = 1,
    gamma = 1,
    negative_sample_rate = 5,
    init_pos = "spectral",
    random_state = 42,
    a = None, b = None,
    key_added = 'umap',
    neighbors_key = "nn30"
)
[21]:
expm.rna.leiden(
    resolution = 0.5,
    restrict_to = None,
    random_state = 42,
    key_added = 'leiden',
    adjacency = None,
    directed = None,
    use_weights = True,
    n_iterations = 2,
    partition_type = None,
    neighbors_key = 'nn30',
    obsp = None,
    flavor = 'igraph'
)
[22]:
fig = expm.rna.plot_embedding(
    basis = 'umap', color = 'leiden',
    figsize = (3, 3), dpi = 100, legend_col = 2, legend = False,
    ptsize = 1, annotate_style = 'text', contour_plot = True
)
TCR Diversity Analysis#
Compute basic TCR statistics.
[23]:
expm.rna.calculate_tcr_metrics(
    expanded_clone = 5
)
[25]:
print(expm)
annotated data of size 11229 × 22165
integrated dataset of size 11229 × 22165
contains modalities: rna

 modality [rna]
    obs : sample <cat> <c/sample> batch <cat> <c/batch> group <cat> <c> modality <cat> <c/modality>
          taxa <cat> <c/taxa> barcode <o> <o> ubc <o> <o> n.umi <f64> <i> n.genes <i64> <i>
          n.mito <f64> <f> n.ribo <f64> <f> pct.mito <f64> <f> pct.ribo <f64> <f>
          filter <bool> <bool> score.doublet <f64> <f> score.doublet.se <f64> <f>
          is.doublet <bool> <bool> qc <bool> <bool/qc> tra <o> trb <o> clone <o> clone.id <o>
          trav <o> traj <o> trbv <o> trbj <o> leiden <cat> <c> trab <bool> tcr.clone.sum <i64> <i>
          tcr.clone.size <i64> <i> tcr.expanded <bool> <bool> tcr.clone.size.rel <f64> <f>
    var : chr <o> <c/chromosome> start <i64> <i> end <i64> <i> strand <o> <c/strand> id <o> <o>
          subtype <o> <c/gsubtype> gene <o> <o/gene> tlen <f64> <i/tlen> cdslen <i64> <i/cdslen>
          assembly <o> <c> uid <o> <o/ugene> vst.means <f64> vst.vars <f64> vst.vars.norm <f64>
          vst.hvg.rank <f32> vst.hvg <bool>
 layers : counts <f32> <i/counts>
   obsm : pca <arr:f64(35)> <f/embedding/pca> knn.nn30 <arr:i32(30)> knn.d.nn30 <arr:f32(30)>
          umap <arr:f32(2)> <f/embedding>
   varm : pca <arr:f64(35)> <f/weights>
   obsp : connectivities.nn30 <csr:f32> distances.nn30 <csr:f32>
    uns : slots <system> commands <system> pca <dict> nn30 <knn> umap leiden leiden.colors

[*] composed of samples:
  pbmc    rna   hsa    batch b-1     of size 11229 × 22165
[24]:
expm['rna'].obs[['trab', 'tcr.clone.sum', 'tcr.clone.size', 'tcr.expanded']]
[24]:
| trab | tcr.clone.sum | tcr.clone.size | tcr.expanded | |
|---|---|---|---|---|
| pbmc:2 | True | 5463 | 1 | False |
| pbmc:3 | True | 5463 | 1 | False |
| pbmc:4 | False | 5463 | 0 | False |
| pbmc:5 | True | 5463 | 1 | False |
| pbmc:6 | True | 5463 | 1 | False |
| ... | ... | ... | ... | ... |
| pbmc:13403 | True | 5463 | 1 | False |
| pbmc:13404 | False | 5463 | 0 | False |
| pbmc:13407 | False | 5463 | 0 | False |
| pbmc:13408 | False | 5463 | 0 | False |
| pbmc:13409 | True | 5463 | 1 | False |
11229 rows × 4 columns
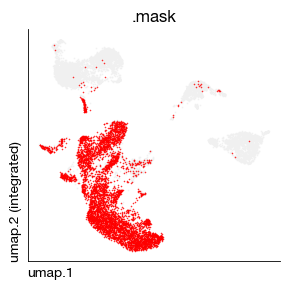
[30]:
fig = expm.rna.plot_embedding_mask(
    basis = 'umap', color = 'trab', values = [True],
    figsize = (3, 3), dpi = 100, legend = False, ptsize = 1,
)
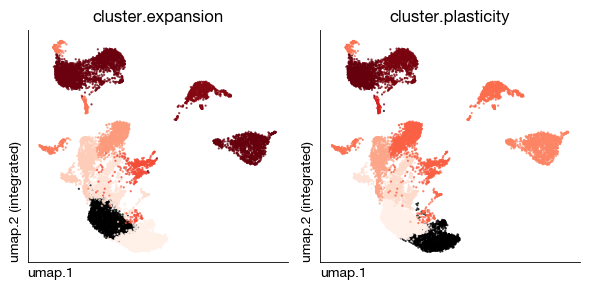
Some Shannon entropy-based methods can provide shared statistics at the single-cell lineage tracing cluster level.
[ ]:
expm.rna.calculate_startracs_metrics(
    clonotype = 'clone.id',
    cluster = 'leiden',
    tissue = None
)
[32]:
print(expm)
annotated data of size 11229 × 22165
integrated dataset of size 11229 × 22165
contains modalities: rna

 modality [rna]
    obs : sample <cat> <c/sample> batch <cat> <c/batch> group <cat> <c> modality <cat> <c/modality>
          taxa <cat> <c/taxa> barcode <o> <o> ubc <o> <o> n.umi <f64> <i> n.genes <i64> <i>
          n.mito <f64> <f> n.ribo <f64> <f> pct.mito <f64> <f> pct.ribo <f64> <f>
          filter <bool> <bool> score.doublet <f64> <f> score.doublet.se <f64> <f>
          is.doublet <bool> <bool> qc <bool> <bool/qc> tra <o> trb <o> clone <o> clone.id <o>
          trav <o> traj <o> trbv <o> trbj <o> leiden <cat> <c> trab <bool> tcr.clone.sum <i64> <i>
          tcr.clone.size <i64> <i> tcr.expanded <bool> <bool> tcr.clone.size.rel <f64> <f>
          cluster.expansion <f64> <f> cluster.plasticity <f64> <f> clone.trans <f64> <f>
    var : chr <o> <c/chromosome> start <i64> <i> end <i64> <i> strand <o> <c/strand> id <o> <o>
          subtype <o> <c/gsubtype> gene <o> <o/gene> tlen <f64> <i/tlen> cdslen <i64> <i/cdslen>
          assembly <o> <c> uid <o> <o/ugene> vst.means <f64> vst.vars <f64> vst.vars.norm <f64>
          vst.hvg.rank <f32> vst.hvg <bool>
 layers : counts <f32> <i/counts>
   obsm : pca <arr:f64(35)> <f/embedding/pca> knn.nn30 <arr:i32(30)> knn.d.nn30 <arr:f32(30)>
          umap <arr:f32(2)> <f/embedding>
   varm : pca <arr:f64(35)> <f/weights>
   obsp : connectivities.nn30 <csr:f32> distances.nn30 <csr:f32>
    uns : slots <system> commands <system> pca <dict> nn30 <knn> umap leiden leiden.colors

[*] composed of samples:
  pbmc    rna   hsa    batch b-1     of size 11229 × 22165
[35]:
fig = expm.rna.plot_multiple_embedding(
    basis = 'umap', ncols = 2, features = [
        'cluster.expansion', 'cluster.plasticity',
    ],
    figsize = (6, 3), dpi = 100, legend_col = 2, legend = False,
    ptsize = 2, annotate_style = 'text',
    cmap = 'reds/r'
)
[36]:
expm.save(save_samples = False)
[i] main dataset write to expm/tcr/integrated.h5mu