Metacell#
Single-cell RNA-seq data exhibits substantial technical noise and sparsity at the individual cell level, making robust gene expression estimation challenging. The metacell approach addresses this by aggregating transcriptomes of highly similar cells into metacells — groups of cells whose expression profiles are statistically indistinguishable given the measurement noise. This aggregation reduces dropout effects, stabilizes variance estimates, and improves the sensitivity of downstream analyses such as differential expression, trajectory inference, and gene regulatory network reconstruction. This notebook demonstrates metacell construction and analysis using the exprmat package, including similarity graph building, metacell partitioning, and visualization of metacell-level expression patterns.
Extremely large datasets (exceeding 5 to 10 million cells) place unbounded demands on computational resources. Since large datasets frequently capture the same phenotype across multiple cells, we can reduce this phenotypic redundancy through various methods. Metacell aggregation is one such algorithm — it averages phenotypically similar cells into a single metacell (typically using the mean of log-transformed expression values). In regions of higher phenotypic density, more original cells may be aggregated into a single metacell, thereby alleviating redundancy and adjusting the sample distribution. (Note: if the average number of original cells per metacell varies, the cell count distribution may shift, potentially affecting cell proportion results). The consequence is a reduced cell count and a denser expression matrix.
Log-transformed expression matrices are generally considered additive because they have already been normalized, whereas raw count matrices are not necessarily additive since different genes may not share the same count distribution family. Normalized (non-log-transformed) matrices are definitely not additive. We therefore output the log-transformed expression matrix as the only reliable state space for metacells.
Once cells have been aggregated by similarity, it is very difficult and inaccurate to recover their batch information and other metadata. Therefore, if your samples exhibit batch effects and you intend to run integration algorithms, you should first run the metacell method on each sample separately, then integrate the aggregated metacell log-expression matrices across batches. Harmony and other kNN-based methods natively support log-expression matrices, while scVI is based on raw counts and claims reasonable stability with normalized pseudo-counts as well.
[1]:
%load_ext autoreload
%autoreload 2
[2]:
import exprmat as em
# set working directory
em.setwd('../../../data')
ver = em.version()
[i] exprmat 0.2.66 / exprmat-db 0.2.66
[i] os: posix (linux)  platform version: 6.8.0-90-generic
[i] loaded configuration from /home/data/yangz/.exprmatrc
[i] current working directory: /home/data/yangz/packages/exprmat/data
[i] current database directory: /home/data/yangz/packages/database (0.2.66)
[i] resident memory: 776.30 MiB
[i] virtual memory: 5.95 GiB
[3]:
expm = em.load_experiment('expm/scrna', load_subset = 'mono-neutro')
━━━━━━━━━━━━━━━━━━━━━━━━━━ loading samples 3 / 3 (00:03 < 00:00)
[4]:
print(expm)
annotated data of size 9754 × 19651
subset mono-neutro of size 9754 × 19651
contains modalities: rna

 modality [rna]
    obs : sample <cat> <c/sample> batch <cat> <c/batch> group <cat> <c> modality <cat> <c/modality>
          taxa <cat> <c/taxa> barcode <o> <o> ubc <o> <o> n.umi <f64> <i> n.genes <i64> <i>
          n.mito <f64> <f> n.ribo <f64> <f> pct.mito <f64> <f> pct.ribo <f64> <f>
          filter <bool> <bool> score.doublet <f64> <f> score.doublet.se <f64> <f>
          is.doublet <bool> <bool> qc <bool> <bool/qc> leiden <cat> <c> sc3.5 <cat> <c>
          sc3.10 <cat> <c> sc3.20 <cat> <c> sc3.30 <cat> <c> cell.type <cat> <c>
    var : chr <cat> <c/chromosome> start <i64> <i> end <i64> <i> strand <cat> <c/strand> id <o> <o>
          subtype <cat> <c/gsubtype> gene <cat> <o/gene> tlen <f64> <i/tlen> cdslen <i64> <i/cdslen>
          assembly <cat> <c> uid <o> <o/ugene> vst.hvg <bool> <bool/hvg> vst.all.means <f64> <f>
          vst.all.vars <f64> <f> vst.all.vars.norm <f64> <f> vst.all.hvg.rank <f32> <f>
          vst.all.hvg <bool> <bool>
 layers : counts <f32> <i/counts> norm <f32> <f>
   obsm : cnmf.10 <df> <f/embedding/usage> harmony <arr:f32(35)> <f> knn <arr:i32(100)> <i/knni>
          knn.d <arr:f32(100)> <f/knnd> pca <arr:f64(35)> <f/embedding/pca>
          umap <arr:f32(2)> <f/embedding>
   varm : cnmf.10 <arr:f64(10)> <f/weights> cnmf.coef.10 <arr:f64(10)> <f/usage-coef>
          pca <arr:f64(35)> <f/weights>
   obsp : connectivities <csr:f32> <f/connectivity> distances <csr:f32> <f/distance>
    uns : cell.type.colors cell.type_colors cnmf <cnmf> cnmf.args <o>
          cnmf.density.10 <cnmf-density> cnmf.dist.10 <f/connectivity> cnmf.stats <cnmf-stats>
          commands <system> leiden <o> leiden.colors <o> markers <markers> neighbors <knn>
          pca <dict> sc3.10.colors <o> sc3.20.colors <o> sc3.30.colors <o> sc3.5.colors <o>
          slots <system> umap <o>

[*] composed of samples:
  distal   rna   mmu    batch b1      of size 6451 × 21689
  niche    rna   mmu    batch b2      of size 3656 × 21970
  normal   rna   mmu    batch b3      of size 4537 × 21917
Computing metacells#
Using the subset of data with pre-computed highly variable genes, we compute fine-grained clustering on the feature space to define metacell partitions.
[5]:
expm.rna.exclude_nonexisting_variables()
[i] removed 299 genes with zero expression.
[6]:
expm.rna.metacell(
    hvg_key = 'vst.all.hvg',
    counts_key = 'counts',
    lognorm_key = 'X',
    n_metacell = 1400,
    datatypes = ['rna'],
    device = 'cuda',
    random_seed = 42,
    train_epoch = 300,
    adam_learning_rate = 1e-3,
    adam_weight_decay = 1e-2,
    codebook_init = 'random',
    converge_threshold = 10,
    batch_size = 32,
)
[i] target metacell number: 1400
[i] training metacell quantization model ...
━━━━━━━━━━━━━━━━━━━━━━━━━━ training network 300 / 300 (03:35 < 00:00)
[i] quantized reconstruction: 0.92
[i] delta assignment confidence: 0.02
[i] codebook loss: 0.05
[i] created subset [integrated-metacell] from sample [integrated]
[7]:
print(expm)
annotated data of size 9754 × 19352
subset mono-neutro of size 9754 × 19352
contains modalities: rna

 modality [rna]
    obs : sample <cat> <c/sample> batch <cat> <c/batch> group <cat> <c> modality <cat> <c/modality>
          taxa <cat> <c/taxa> barcode <o> <o> ubc <o> <o> n.umi <f64> <i> n.genes <i64> <i>
          n.mito <f64> <f> n.ribo <f64> <f> pct.mito <f64> <f> pct.ribo <f64> <f>
          filter <bool> <bool> score.doublet <f64> <f> score.doublet.se <f64> <f>
          is.doublet <bool> <bool> qc <bool> <bool/qc> leiden <cat> <c> sc3.5 <cat> <c>
          sc3.10 <cat> <c> sc3.20 <cat> <c> sc3.30 <cat> <c> cell.type <cat> <c>
    var : chr <cat> <c/chromosome> start <i64> <i> end <i64> <i> strand <cat> <c/strand> id <o> <o>
          subtype <cat> <c/gsubtype> gene <cat> <o/gene> tlen <f64> <i/tlen> cdslen <i64> <i/cdslen>
          assembly <cat> <c> uid <o> <o/ugene> vst.hvg <bool> <bool/hvg> vst.all.means <f64> <f>
          vst.all.vars <f64> <f> vst.all.vars.norm <f64> <f> vst.all.hvg.rank <f32> <f>
          vst.all.hvg <bool> <bool>
 layers : counts <f32> <i/counts> norm <f32> <f>
   obsm : cnmf.10 <df> <f/embedding/usage> harmony <arr:f32(35)> <f> knn <arr:i32(100)> <i/knni>
          knn.d <arr:f32(100)> <f/knnd> pca <arr:f64(35)> <f/embedding/pca>
          umap <arr:f32(2)> <f/embedding>
   varm : cnmf.10 <arr:f64(10)> <f/weights> cnmf.coef.10 <arr:f64(10)> <f/usage-coef>
          pca <arr:f64(35)> <f/weights>
   obsp : connectivities <csr:f32> <f/connectivity> distances <csr:f32> <f/distance>
    uns : cell.type.colors cell.type_colors cnmf <cnmf> cnmf.args <o>
          cnmf.density.10 <cnmf-density> cnmf.dist.10 <f/connectivity> cnmf.stats <cnmf-stats>
          commands <system> leiden <o> leiden.colors <o> markers <markers> neighbors <knn>
          pca <dict> sc3.10.colors <o> sc3.20.colors <o> sc3.30.colors <o> sc3.5.colors <o>
          slots <system> umap <o>

[*] composed of samples:
  distal                rna   mmu    batch b1        of size 6451 × 21689
  niche                 rna   mmu    batch b2        of size 3656 × 21970
  normal                rna   mmu    batch b3        of size 4537 × 21917
  integrated-metacell   rna   autogen   batch autogen   of size 1277 × 19352
Metacell structure#
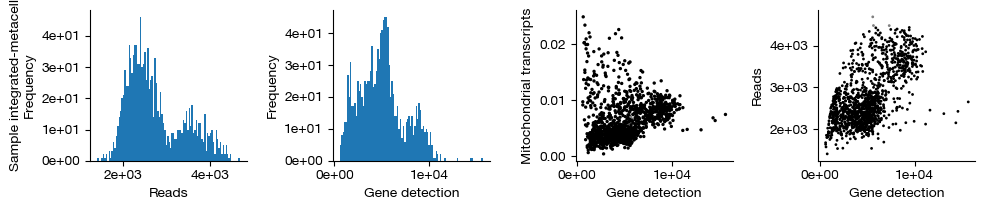
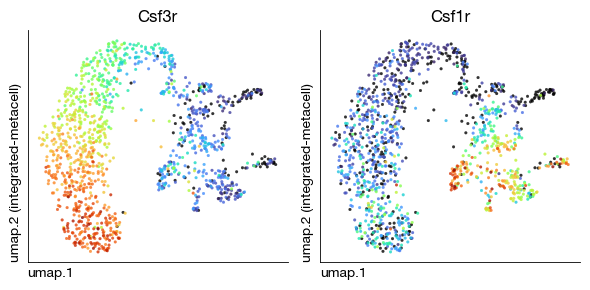
The computed metacells are incorporated into the corresponding modality’s sample list under the default sample name metacell. We proceed with QC filtering on the metacell sample to remove low-quality metacells, then perform PCA, KNN graph construction, and UMAP embedding to visualize the metacell-level expression landscape.
[9]:
expm.rna.qc(
    run_on_samples = ['integrated-metacell'],
    mt_seqid = 'chrM',
    mt_percent = 0.15,
    ribo_genes = None,
    ribo_percent = None,
    outlier_mode = 'mads',
    outlier_n = 5,
    doublet_method = 'no',
    min_cells = 3,
    min_genes = 300
)
[i] found 13 mitochondrial genes (expected 13)
[i] found 105 ribosomal genes
quality controlling sample [integrated-metacell] ...
raw dataset contains 1277 cells, 18903 genes
filtered dataset contains 1274 cells, 18425 genes
[10]:
figs = expm.rna.plot_qc(run_on_samples = ['integrated-metacell'])
[11]:
expm.rna.scale_pca(
    run_on_samples = ['integrated-metacell'],
    hvg = 'vst.hvg',
    key_lognorm = 'X',
    key_scaled = 'scaled',
    key_added = 'pca', n_comps = 35,
    keep_sparse = False,
    random_state = 42,
    svd_solver = 'arpack'
)
[12]:
expm.rna.knn(
    run_on_samples = ['integrated-metacell'],
    use_rep = 'pca',
    n_comps = None,
    n_neighbors = 30,
    knn = True,
    method = "umap",
    transformer = None,
    metric = "euclidean",
    metric_kwds = {},
    random_state = 42,
    key_added = 'neighbors'
)
[13]:
expm.rna.umap(
    run_on_samples = ['integrated-metacell'],
    min_dist = 0.5,
    spread = 1,
    n_components = 2,
    maxiter = None,
    alpha = 1,
    gamma = 1,
    negative_sample_rate = 5,
    init_pos = "spectral",
    random_state = 42,
    a = None, b = None,
    key_added = 'umap',
    neighbors_key = "neighbors"
)
[18]:
fig = expm.rna.plot_multiple_embedding(
    run_on_samples = ['integrated-metacell'], ncols = 2,
    basis = 'umap', features = ['Csf3r', 'Csf1r'], annotate_style = 'text', legend = False,
    figsize = (6, 3), dpi = 100, ptsize = 4, contour_plot = False
)
[19]:
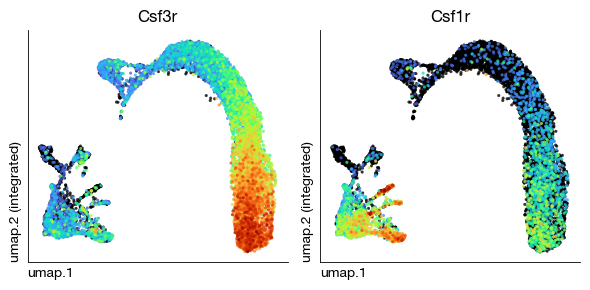
fig = expm.rna.plot_multiple_embedding(
    run_on_samples = False, ncols = 2,
    basis = 'umap', features = ['Csf3r', 'Csf1r'], annotate_style = 'text', legend = False,
    figsize = (6, 3), dpi = 100, ptsize = 4, contour_plot = False
)
[20]:
expm.save()
[i] main dataset write to expm/scrna/subsets/mono-neutro.h5mu
[i] saving individual samples. (pass `save_samples = False` to skip)
━━━━━━━━━━━━━━━━━━━━━━━━━━ modality [rna] 4 / 4 (00:01 < 00:00)