Composition Analysis#
Analysis of cellular composition and modules
[1]:
%load_ext autoreload
%autoreload 2
[2]:
import exprmat as em
# set working directory
em.setwd('../../../data')
ver = em.version()
[i] exprmat 0.2.66 / exprmat-db 0.2.66
[i] os: posix (linux)  platform version: 6.8.0-90-generic
[i] loaded configuration from /home/data/yangz/.exprmatrc
[i] current working directory: /home/data/yangz/packages/exprmat/data
[i] current database directory: /home/data/yangz/packages/database (0.2.66)
[i] resident memory: 778.86 MiB
[i] virtual memory: 5.95 GiB
[ ]:
expm = em.load_experiment('... hidden ...', load_samples = False)
[!] samples are not dumped in the experiment directory.
scCODA#
scCODA offers Bayesian estimate of compositional change across conditions with a pre-defined cluster that assumes no change between conditions. scCODA requires duplicates in experiment design
[8]:
expm.rna.sccoda(
    major = 'sample', minor = 'cell.type',
    categories = ['group'], agg = lambda x: x.value_counts().idxmax(),
    formula = 'group', num_samples = 10000, num_warmup = 1000, seed = 42,
    key_added = 'sccoda'
)
[i] automatic reference selection: reference cell type set to Mast
[i] zero counts encountered in data! Added a pseudocount of 0.5.
[9]:
expm['rna'].uns['sccoda.effects'].reset_index()
[9]:
| index | Covariate | Cell Type | Final Parameter | HDI 3% | HDI 97% | SD | Inclusion probability | Expected Sample | log2-fold change | |
|---|---|---|---|---|---|---|---|---|---|---|
| 0 | 0 | groupT.ln-neg | B | 2.419516 | 1.329 | 3.477 | 0.559 | 1.0000 | 3718.928437 | 3.385593 |
| 1 | 1 | groupT.ln-neg | EC | 0.000000 | -1.969 | 0.312 | 0.598 | 0.5165 | 201.476927 | -0.105031 |
| 2 | 2 | groupT.ln-neg | Epi | 0.000000 | -2.353 | 0.008 | 0.754 | 0.8335 | 626.203168 | -0.105031 |
| 3 | 3 | groupT.ln-neg | Fib/SMC | -1.501326 | -2.680 | 0.001 | 0.847 | 0.8570 | 79.467573 | -2.270986 |
| 4 | 4 | groupT.ln-neg | Mast | 0.000000 | 0.000 | 0.000 | 0.000 | 0.0000 | 175.155625 | -0.105031 |
| 5 | 5 | groupT.ln-neg | Mye | -1.480736 | -2.662 | 0.001 | 0.839 | 0.8475 | 134.685051 | -2.241281 |
| 6 | 6 | groupT.ln-neg | Neu | -2.839706 | -4.069 | -1.675 | 0.631 | 1.0000 | 126.972284 | -4.201861 |
| 7 | 7 | groupT.ln-neg | Plasma | 0.000000 | -1.790 | 0.350 | 0.538 | 0.4855 | 314.402769 | -0.105031 |
| 8 | 8 | groupT.ln-neg | T | 0.000000 | -0.029 | 1.723 | 0.571 | 0.6337 | 3280.249834 | -0.105031 |
| 9 | 9 | groupT.ln-pos | B | 3.494247 | 2.555 | 4.426 | 0.488 | 1.0000 | 2587.151433 | 2.862070 |
| 10 | 10 | groupT.ln-pos | EC | 0.000000 | -1.567 | 0.755 | 0.432 | 0.3674 | 47.849719 | -2.179063 |
| 11 | 11 | groupT.ln-pos | Epi | 0.000000 | -1.743 | 0.568 | 0.485 | 0.4071 | 148.719986 | -2.179063 |
| 12 | 12 | groupT.ln-pos | Fib/SMC | 0.000000 | -2.269 | 0.251 | 0.694 | 0.5753 | 84.695735 | -2.179063 |
| 13 | 13 | groupT.ln-pos | Mast | 0.000000 | 0.000 | 0.000 | 0.000 | 0.0000 | 41.598547 | -2.179063 |
| 14 | 14 | groupT.ln-pos | Mye | 0.000000 | -2.226 | 0.097 | 0.718 | 0.6206 | 140.620567 | -2.179063 |
| 15 | 15 | groupT.ln-pos | Neu | -2.071768 | -3.152 | -0.922 | 0.585 | 0.9985 | 64.994181 | -5.167992 |
| 16 | 16 | groupT.ln-pos | Plasma | 0.000000 | -1.211 | 0.851 | 0.302 | 0.2940 | 74.669018 | -2.179063 |
| 17 | 17 | groupT.ln-pos | T | 1.948464 | 1.087 | 2.776 | 0.443 | 1.0000 | 5467.242481 | 0.631977 |
CoVarNet#
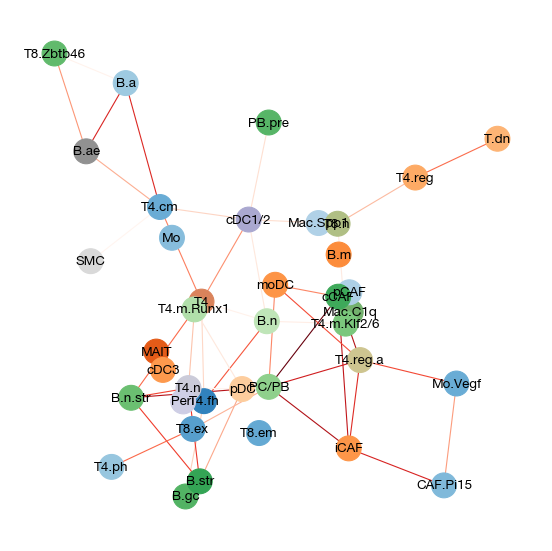
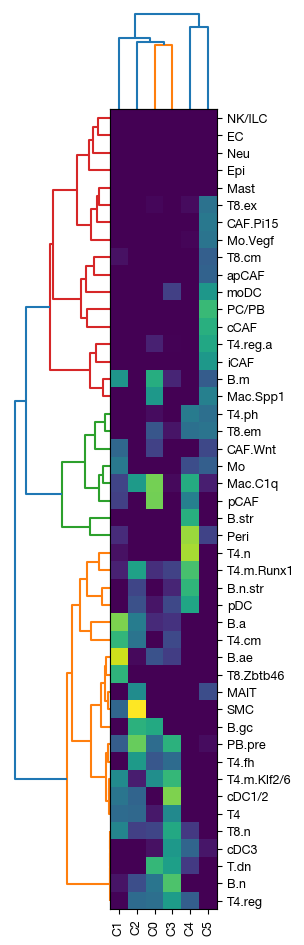
CoVarNet provides a standardized method for cellular module calling. It normalize subtypes according to major types (that may have similar loss ratio during sample preparation), and constructs correlation network for cellular compositions
[10]:
expm.rna.annotate(
    cluster = 'cell.type.fine',
    mapping = {
        'B': ['B.a', 'B.ae', 'B.gc', 'B.m', 'B.n', 'B.n.str', 'B.str', 'PC/PB', 'PB.pre'],
        'Fib': ['CAF.Pi15', 'CAF.Wnt', 'Peri', 'SMC', 'apCAF', 'cCAF', 'iCAF', 'pCAF'],
        'T': ['MAIT', 'T.dn', 'T4', 'T4.fh', 'T4.m.Klf2/6', 'T4.m.Runx1', 'T4.n', 'T4.ph', 'T4.reg', 'T4.reg.a', 'T4.cm',
              'T8.n', 'T8.cm', 'T8.em', 'T8.ex', 'T8.Zbtb46'],
        'Mye': ['Mo', 'Mo.Vegf', 'Mac.C1q', 'Mac.Spp1', 'cDC1/2', 'cDC3', 'moDC', 'pDC']
    }
)
cell.type
T         53594
B         29837
Neu        8539
Epi        3229
Mye        3174
Fib        2251
NK/ILC     1612
EC          972
Mast        682
Name: count, dtype: int64
[ ]:
expm.rna.covar_module_cophenetic(
    col_sample = 'sample', col_major = 'cell.type', col_fine = 'cell.type.fine',
    nmf_clusters = [2, 3, 4, 5, 6, 7, 8, 9, 10], n_run = 30, max_iter = 300,
    key_added = 'covarnet'
)
[17]:
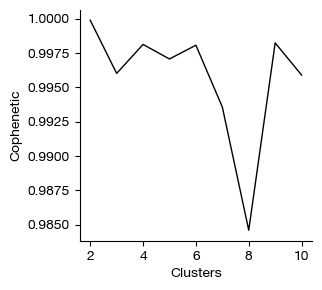
expm['rna'].uns['covarnet.coph']
[17]:
| cluster | rss | evar | cophenetic | |
|---|---|---|---|---|
| 0 | 2 | 35.222438 | 0.648837 | 0.999879 |
| 1 | 3 | 28.013027 | 0.720714 | 0.996009 |
| 2 | 4 | 23.347266 | 0.767231 | 0.998115 |
| 3 | 5 | 19.959535 | 0.801006 | 0.997059 |
| 4 | 6 | 17.024616 | 0.830267 | 0.998060 |
| 5 | 7 | 14.863218 | 0.851816 | 0.993559 |
| 6 | 8 | 13.080866 | 0.869586 | 0.984591 |
| 7 | 9 | 11.259840 | 0.887741 | 0.998228 |
| 8 | 10 | 10.143420 | 0.898871 | 0.995887 |
[18]:
from exprmat.plotting.utils import line
fig = line(
    expm['rna'].uns['covarnet.coph']['cluster'], expm['rna'].uns['covarnet.coph']['cophenetic'],
    xlabel = 'Clusters', ylabel = 'Cophenetic'
)
[ ]:
expm.rna.covar_module(
    col_sample = 'sample', col_major = 'cell.type', col_fine = 'cell.type.fine',
    nmf_clusters = 6, n_run = 10, max_iter = 300,
    key_added = 'covarnet'
)
[20]:
print(expm)
annotated data of size 103890 × 30216
integrated dataset of size 103890 × 30216
contains modalities: rna

 modality [rna]
    obs : sample <cat> batch <cat> group <cat> modality <cat> taxa <cat> patient <cat> barcode <o>
          ubc <o> n.umi <f64> n.genes <i64> n.mito <f64> n.ribo <f64> pct.mito <f64> pct.ribo <f64>
          filter <bool> score.doublet <f64> score.doublet.se <f64> is.doublet <bool> qc <bool>
          kde.group <f64> leiden <cat> cell.type <cat> <c> cell.type.fine <cat>
    var : chr <cat> start <i64> end <i64> strand <cat> id <o> subtype <cat> gene <cat> tlen <f64>
          cdslen <i64> assembly <cat> uid <o> vst.means <f64> vst.vars <f64> vst.vars.norm <f64>
          vst.hvg.rank <f32> vst.hvg <bool>
 layers : ambiguous <f64> counts <f32> spliced <f64> unspliced <f64>
   obsm : harmony <arr:f64(20)> knn.d.nn <arr:f32(30)> knn.d.nn.harmony <arr:f32(30)>
          knn.nn <arr:i32(30)> knn.nn.harmony <arr:i32(30)> pca <arr:f64(50)> pca.20 <arr:f64(20)>
          scvi <arr:f32(30)> umap <arr:f32(2)> umap.harmony <arr:f32(2)>
   varm : pca <arr:f64(50)>
   obsp : connectivities.nn <csr:f32> connectivities.nn.harmony <csr:f32> distances.nn <csr:f32>
          distances.nn.harmony <csr:f32>
    uns : cell.type.colors cell.type.fine.colors deg group.colors kde.group leiden leiden.colors nn
          nn.harmony pca scvi umap umap.harmony sccoda.intercepts sccoda.effects commands <system>
          slots <system> covarnet.coph covarnet.corr covarnet <covarnet> covarnet.comp
          covarnet.usage

[*] samples not loaded from disk.
[21]:
fig = expm.rna.plot_covarnet(
    key = 'covarnet', node_size = 500, cmap = 'category20c', cmap_edge = 'reds/r',
    figsize = (7, 7), dpi = 80
)
[23]:
fig = expm.rna.plot_covarnet_components(
    key = 'covarnet', figsize = (2.3, 10)
)
[27]:
fig = expm.rna.plot_covarnet_usages(
    key = 'covarnet', figsize = (3.7, 2.3)
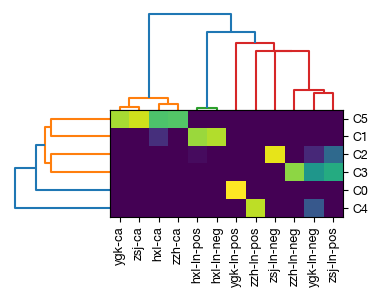
)