Ligand-receptor interaction analysis#
Several computational tools have emerged for inferring cell-cell communication from single-cell transcriptomics. These tools can be divided into two categories: those that only predict cell-cell communication interactions, commonly referred to as ligand-receptor inference methods, and those that additionally estimate intracellular activity induced by cell-cell communication. Both types of tools use gene expression information as a proxy for protein abundance and typically require clustering cells into biologically meaningful groups. These cell-cell communication tools infer interactions between cell groups, where one group serves as the source of the communication event and the other as the receiver. Thus, cell-cell communication events are typically represented as interactions between proteins from the source and receiver cell groups.
Information about interacting proteins is generally extracted from prior knowledge resources. In ligand-receptor methods, interactions can also be represented through heteromeric protein complexes, as different subunit combinations can induce different responses, and incorporating protein complex information has been shown to reduce false positive rates. On the other hand, methods that model intracellular signaling also utilize functional information from the receiver cell type, and therefore require additional data such as intracellular protein-protein interaction networks and/or gene regulatory interactions.
[1]:
%load_ext autoreload
%autoreload 2
[2]:
import exprmat as em
# set working directory
em.setwd('../../../data')
ver = em.version()
[i] exprmat 0.2.66 / exprmat-db 0.2.66
[i] os: posix (linux)  platform version: 6.8.0-90-generic
[i] loaded configuration from /home/data/yangz/.exprmatrc
[i] current working directory: /home/data/yangz/packages/exprmat/data
[i] current database directory: /home/data/yangz/packages/database (0.2.66)
[i] resident memory: 775.17 MiB
[i] virtual memory: 5.95 GiB
[3]:
expm = em.load_experiment('expm/scrna', load_samples = False, load_subset = 'mono-neutro')
[!] samples are not dumped in the experiment directory.
[4]:
print(expm)
annotated data of size 9754 × 19651
subset mono-neutro of size 9754 × 19651
contains modalities: rna

 modality [rna]
    obs : sample <cat> <c/sample> batch <cat> <c/batch> group <cat> <c> modality <cat> <c/modality>
          taxa <cat> <c/taxa> barcode <o> <o> ubc <o> <o> n.umi <f64> <i> n.genes <i64> <i>
          n.mito <f64> <f> n.ribo <f64> <f> pct.mito <f64> <f> pct.ribo <f64> <f>
          filter <bool> <bool> score.doublet <f64> <f> score.doublet.se <f64> <f>
          is.doublet <bool> <bool> qc <bool> <bool/qc> leiden <cat> <c> sc3.5 <cat> <c>
          sc3.10 <cat> <c> sc3.20 <cat> <c> sc3.30 <cat> <c> cell.type <cat> <c>
          kde.umap <f64> <f/kde> psbulk <cat>
    var : chr <cat> <c/chromosome> start <i64> <i> end <i64> <i> strand <cat> <c/strand> id <o> <o>
          subtype <cat> <c/gsubtype> gene <cat> <o/gene> tlen <f64> <i/tlen> cdslen <i64> <i/cdslen>
          assembly <cat> <c> uid <o> <o/ugene> vst.hvg <bool> <bool/hvg> vst.all.means <f64> <f>
          vst.all.vars <f64> <f> vst.all.vars.norm <f64> <f> vst.all.hvg.rank <f32> <f>
          vst.all.hvg <bool> <bool>
 layers : counts <f32> <i/counts> norm <f32> <f>
   obsm : cnmf.10 <df> <f/embedding/usage> harmony <arr:f32(35)> <f> knn <arr:i32(100)> <i/knni>
          knn.d <arr:f32(100)> <f/knnd> pca <arr:f64(35)> <f/embedding/pca>
          umap <arr:f32(2)> <f/embedding>
   varm : cnmf.10 <arr:f64(10)> <f/weights> cnmf.coef.10 <arr:f64(10)> <f/usage-coef>
          pca <arr:f64(35)> <f/weights>
   obsp : connectivities <csr:f32> <f/connectivity> distances <csr:f32> <f/distance>
    uns : cell.type.colors cell.type_colors cnmf <cnmf> cnmf.args <o>
          cnmf.density.10 <cnmf-density> cnmf.dist.10 <f/connectivity> cnmf.stats <cnmf-stats>
          commands <system> kde.umap <kde-stats> leiden <o> leiden.colors <o> markers <markers>
          neighbors <knn> pca <dict> sc3.10.colors <o> sc3.20.colors <o> sc3.30.colors <o>
          sc3.5.colors <o> slots <system> umap <o>

[*] samples not loaded from disk.
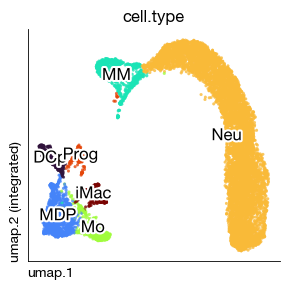
[6]:
fig = expm.rna.plot_embedding(
    basis = 'umap', color = 'cell.type', annotate_style = 'text', legend = False,
    figsize = (3, 3), dpi = 100, ptsize = 4, contour_plot = False, slot = 'magic'
)
Ligand-receptor communication analysis#
For human and mouse, comprehensive database resources are already available for ligand-receptor analysis.
[7]:
expm.rna.ligand_receptor(
    flavor = 'ra',
    taxa_source = 'mmu',
    taxa_dest = 'mmu',
    gene_symbol = None,
    groupby = 'cell.type',
    use_raw = False,
    min_cells = 5,
    expr_prop = 0.1,
    n_perms = 500,
    seed = 42,
    de_method = 't-test',
    resource_name = 'consensus',
    verbose = True,
    key_added = 'lr',
    n_jobs = 50
)
━━━━━━━━━━━━━━━━━━━━━━━━━━ 500 / 500 (00:17 < 00:00)
[i] running cellphonedb
━━━━━━━━━━━━━━━━━━━━━━━━━━ 500 / 500 (00:01 < 00:00)
[i] running connectome
[i] running logfc
[i] running natmi
[i] running scseqcomm
[i] running singlecellsignalr
[8]:
expm.rna.get_lr(
    source_labels = 'Neu',
    target_labels = 'MDP',
    filter_fun = lambda x: (
        (x['cellchat.p'] < 0.05) &
        (x['lr.means'] > 0.5) &
        (x['magnitude'] >= 0.05)
    ),
    orderby = 'magnitude'
)[[
    'source', 'ligand.complex', 'target', 'receptor.complex',
    'lr.probs', 'lr.means', 'cellchat.p', 'specificity', 'magnitude'
]]
[8]:
| source | ligand.complex | target | receptor.complex | lr.probs | lr.means | cellchat.p | specificity | magnitude | |
|---|---|---|---|---|---|---|---|---|---|
| 7744 | Neu | Timp2 | MDP | Itgb1 | 0.024075 | 0.941626 | 0.000 | 0.055215 | 0.053848 |
| 7570 | Neu | C3 | MDP | Lrp1 | 0.020522 | 0.906975 | 0.000 | 0.076983 | 0.069470 |
| 7549 | Neu | App | MDP | Lrp10 | 0.018705 | 0.896630 | 0.000 | 0.154539 | 0.075968 |
| 7533 | Neu | Alcam | MDP | Nrp1 | 0.016223 | 0.892363 | 0.000 | 0.096843 | 0.078477 |
| 7545 | Neu | App | MDP | Aplp2 | 0.017906 | 0.890198 | 0.000 | 0.154539 | 0.079706 |
| 7745 | Neu | Tln1 | MDP | Itgb5 | 0.008847 | 0.956893 | 0.000 | 0.154539 | 0.084781 |
| 7561 | Neu | Arpc5 | MDP | Ldlr | 0.008132 | 1.054119 | 0.000 | 0.154539 | 0.102947 |
| 7618 | Neu | H2-K1 | MDP | Aplp2 | 0.016434 | 0.857278 | 0.000 | 1.000000 | 0.103778 |
| 7555 | Neu | App | MDP | Tnfrsf21 | 0.015277 | 0.852304 | 0.000 | 0.304696 | 0.107374 |
| 7551 | Neu | App | MDP | Ncstn | 0.013254 | 0.809421 | 0.000 | 0.154539 | 0.147716 |
| 7735 | Neu | Thbs1 | MDP | Cd47 | 0.006768 | 0.993382 | 0.000 | 0.362101 | 0.151609 |
| 7511 | Neu | Actr2 | MDP | Ldlr | 0.006697 | 0.901519 | 0.000 | 0.154539 | 0.154032 |
| 7576 | Neu | Camp | MDP | P2rx7 | 0.010242 | 1.554048 | 0.000 | 0.154539 | 0.162357 |
| 7740 | Neu | Thbs1 | MDP | Ptprj | 0.006284 | 0.937751 | 0.000 | 0.270331 | 0.179992 |
| 7515 | Neu | Adam10 | MDP | Il6ra | 0.006512 | 0.743551 | 0.006 | 0.198188 | 0.227656 |
| 7535 | Neu | Anxa2 | MDP | Tlr2 | 0.008042 | 1.133962 | 0.000 | 0.154539 | 0.232450 |
| 7660 | Neu | Ltb | MDP | Tnfrsf1a | 0.013051 | 0.708727 | 0.000 | 0.154539 | 0.290506 |
| 7639 | Neu | Inhba | MDP | Actr2 | 0.004787 | 0.926168 | 0.000 | 0.207423 | 0.303735 |
| 7571 | Neu | C3 | MDP | Nrp1 | 0.011390 | 0.701406 | 0.000 | 0.154539 | 0.304305 |
| 7738 | Neu | Thbs1 | MDP | Lrp1 | 0.004713 | 0.763979 | 0.000 | 0.055215 | 0.311579 |
| 7736 | Neu | Thbs1 | MDP | Itga4 | 0.004659 | 0.756301 | 0.000 | 0.320136 | 0.320231 |
| 7573 | Neu | Calr | MDP | Lrp1 | 0.004574 | 0.697135 | 0.000 | 1.000000 | 0.331443 |
| 7590 | Neu | Ceacam1 | MDP | Havcr2 | 0.002897 | 0.510467 | 0.000 | 0.154539 | 0.337120 |
| 7617 | Neu | Grn | MDP | Tnfrsf1b | 0.011414 | 0.678940 | 0.000 | 1.000000 | 0.357966 |
| 7627 | Neu | Hsp90b1 | MDP | Lrp1 | 0.004263 | 0.701827 | 0.000 | 1.000000 | 0.368501 |
| 7529 | Neu | Adam17 | MDP | Itgb1 | 0.002927 | 0.642050 | 0.000 | 0.382621 | 0.436023 |
| 7711 | Neu | Sema4a | MDP | Plxnb2 | 0.009535 | 0.643411 | 0.000 | 0.055215 | 0.449164 |
| 7520 | Neu | Adam10 | MDP | Tspan14 | 0.003671 | 0.520230 | 0.000 | 0.386216 | 0.466068 |
| 7527 | Neu | Adam17 | MDP | Il6ra | 0.003121 | 0.663994 | 0.000 | 0.263618 | 0.472090 |
| 7565 | Neu | C3 | MDP | C3ar1 | 0.005675 | 0.628210 | 0.000 | 0.059432 | 0.495488 |
| 7588 | Neu | Cd177 | MDP | Pecam1 | 0.003012 | 0.755761 | 0.000 | 0.186533 | 0.501230 |
| 7712 | Neu | Sema4a | MDP | Plxnd1 | 0.005959 | 0.561873 | 0.000 | 0.055215 | 0.514707 |
| 7634 | Neu | Hspa8 | MDP | Ldlr | 0.003245 | 0.562931 | 0.000 | 1.000000 | 0.547963 |
| 7550 | Neu | App | MDP | Lrp6 | 0.004149 | 0.727385 | 0.000 | 0.193251 | 0.552410 |
| 7538 | Neu | Apoe | MDP | Lrp1 | 0.003123 | 0.711129 | 0.000 | 1.000000 | 0.576276 |
| 7764 | Neu | Vcl | MDP | Itgb5 | 0.003792 | 0.560963 | 0.000 | 0.154539 | 0.610284 |
| 7681 | Neu | Pi16 | MDP | Tnfrsf21 | 0.007785 | 0.583856 | 0.000 | 0.164999 | 0.635763 |
| 7611 | Neu | Gnas | MDP | Adcy7 | 0.008156 | 0.581460 | 0.000 | 1.000000 | 0.643255 |
| 7635 | Neu | Il16 | MDP | Ccr5 | 0.003853 | 0.553870 | 0.000 | 0.066918 | 0.647193 |
| 7715 | Neu | Sema4d | MDP | Plxnb2 | 0.007355 | 0.554517 | 0.000 | 0.154539 | 0.667702 |
| 7562 | Neu | B2m | MDP | Hfe | 0.006598 | 1.166142 | 0.000 | 1.000000 | 0.672097 |
| 7593 | Neu | Copa | MDP | Cd74 | 0.002609 | 0.720646 | 0.000 | 0.878713 | 0.693046 |
| 7596 | Neu | Entpd1 | MDP | Adora2b | 0.002240 | 0.628008 | 0.000 | 0.063459 | 1.000000 |
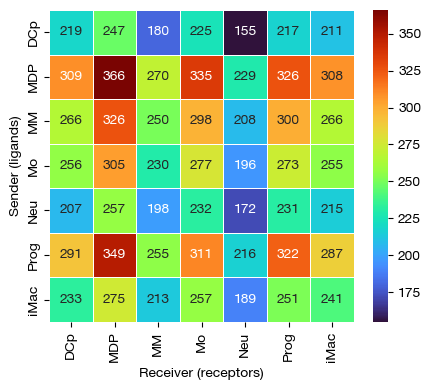
[9]:
fig = expm.rna.plot_lr_heatmap(
    lr_key = 'lr', groupby = 'cell.type',
    figure_size = (4.5, 4)
)
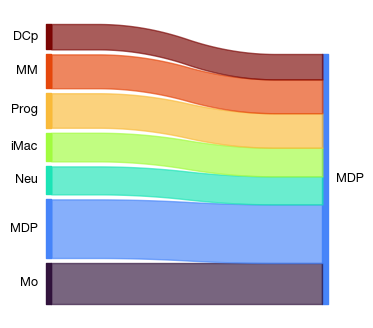
[12]:
table = expm.rna.get_lr(
    source_labels = None,
    target_labels = 'MDP',
    filter_fun = lambda x: (
        (x['cellchat.p'] < 0.05) &
        (x['lr.means'] > 0.5) &
        (x['magnitude'] >= 0.05)
    ),
    orderby = 'magnitude'
)[[
    'source', 'ligand.complex', 'target', 'receptor.complex',
    'lr.probs', 'lr.means', 'cellchat.p', 'specificity', 'magnitude'
]]

# sankey plots on custom adata object is not exported. a hack here.
from exprmat.reader.rna import rna_plot_sankey
table.index = table.index.astype(str)
fig = rna_plot_sankey(em.ad.AnnData(obs = table), None, None, obs1 = 'source', obs2 = 'target')
[22]:
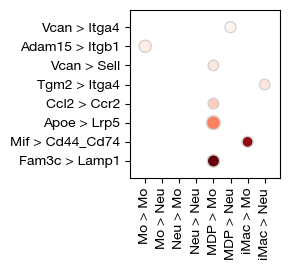
fig = expm.rna.plot_lr_dotplot(
    source_labels = ['Mo', 'Neu', 'MDP', 'iMac'],
    target_labels = ['Mo', 'Neu'],
    filter_fun = lambda x: (
        (x['cellchat.p'] < 0.05) &
        (x['lr.means'] > 0.5) &
        (x['magnitude'] >= 0.7)
    ),
    colour = 'magnitude',
    size = 'lr.means',
    lr_key = 'lr',
    orderby = 'lr.means',
    figure_size = (3, 2.8),
    size_ratio = 3,
    cmap = 'reds/r',

    # paired from source_labels, dest_labels
    paired = False
)
Using databases from other species#
For other species, we may wish to transfer existing databases using homologous genes. For example, here we use the human database and map it to mouse (although this is unnecessary and introduces additional interpretability challenges).
[23]:
expm.rna.ligand_receptor(
    flavor = 'ra',

    # use human database
    taxa_source = 'hsa',
    taxa_dest = 'mmu',

    gene_symbol = None,
    groupby = 'cell.type',
    use_raw = False,
    min_cells = 5,
    expr_prop = 0.1,
    n_perms = 500,
    seed = 42,
    de_method = 't-test',

    # select a database that is only available to humans
    resource_name = 'cellphonedb',

    verbose = True,
    key_added = 'lr.hsa',
    n_jobs = 50
)
━━━━━━━━━━━━━━━━━━━━━━━━━━ 500 / 500 (00:05 < 00:00)
[i] running cellphonedb
━━━━━━━━━━━━━━━━━━━━━━━━━━ 500 / 500 (00:00 < 00:00)
[i] running connectome
[i] running logfc
[i] running natmi
[i] running scseqcomm
[i] running singlecellsignalr
[25]:
expm.rna.get_lr(
    source_labels = 'Neu',
    target_labels = 'MDP',
    filter_fun = lambda x: (
        (x['cellchat.p'] < 0.05) &
        (x['lr.means'] > 0.5) &
        (x['magnitude'] >= 0.05)
    ),
    orderby = 'magnitude',
    slot = 'lr.hsa'
)[[
    'source', 'ligand.complex', 'target', 'receptor.complex',
    'lr.probs', 'lr.means', 'cellchat.p', 'specificity', 'magnitude'
]]
[25]:
| source | ligand.complex | target | receptor.complex | lr.probs | lr.means | cellchat.p | specificity | magnitude | |
|---|---|---|---|---|---|---|---|---|---|
| 730 | Neu | Grn | MDP | Tnfrsf1b | 0.011414 | 0.678940 | 0.0 | 1.000000 | 0.392257 |
| 740 | Neu | Ltb | MDP | Ltbr | 0.006450 | 0.557579 | 0.0 | 0.154963 | 0.433573 |
| 727 | Neu | Entpd1 | MDP | Adora2b | 0.002240 | 0.628008 | 0.0 | 0.052947 | 1.000000 |
[ ]:
expm.save()
Intracellular receptor signaling activity inference#
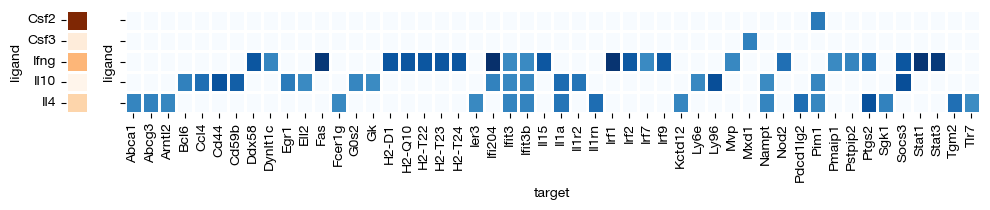
NicheNet can prioritize the inference of intrinsic receptor activity by incorporating intracellular expression regulatory networks of target signals, regardless of whether the ligand is captured in the current dataset. We first need to identify differentially expressed genes between two cell groups, and then perform inference based on these DE genes.
For example, if we want to understand which signaling pathway activation is most likely responsible for the genes that change during neutrophil maturation from myeloid cells, we obtain the upregulated DE genes in Neu relative to MM.
[26]:
expm.rna.markers(
    groupby = 'cell.type',
    mask_var = None,
    groups = ['Neu'],
    reference = 'MM',
    n_genes = None, rankby_abs = False, pts = True,
    key_added = 'deg',
    method = 't-test',
    corr_method = 'benjamini-hochberg',
    tie_correct = False,
    gene_symbol = 'gene',
    layer = 'X'
)
[28]:
upreg = expm.rna.get_markers(
    slot = 'deg',
    min_pct = 0.0,
    max_pct_reference = 0.75,
    max_q = 0.05,
    min_lfc = 0.5, max_lfc = 25,
    remove_zero_pval = False
)

upreg
[i] fetched diff `Neu` over `MM` (2671 genes)
[28]:
| names | scores | lfc | p | q | gene | pct | log10.p | log10.q | |
|---|---|---|---|---|---|---|---|---|---|
| 0 | rna:mmu:g23254 | 88.062660 | 5.080193 | 0.000000 | 0.000000 | Retnlg | 0.981360 | 300.000000 | 300.000000 |
| 1 | rna:mmu:g1350 | 80.203453 | 3.973848 | 0.000000 | 0.000000 | Cxcr2 | 0.917238 | 300.000000 | 300.000000 |
| 2 | rna:mmu:g9641 | 78.552460 | 3.968456 | 0.000000 | 0.000000 | Slfn1 | 0.893976 | 300.000000 | 300.000000 |
| 3 | rna:mmu:g39854 | 78.243988 | 4.206313 | 0.000000 | 0.000000 | Hacd4 | 0.793170 | 300.000000 | 300.000000 |
| 4 | rna:mmu:g31928 | 77.418846 | 4.272014 | 0.000000 | 0.000000 | Dhrs9 | 0.780644 | 300.000000 | 300.000000 |
| ... | ... | ... | ... | ... | ... | ... | ... | ... | ... |
| 3160 | rna:mmu:g53172 | 2.240569 | 0.755317 | 0.025224 | 0.048289 | Trim3 | 0.020131 | 1.598182 | 1.316156 |
| 3162 | rna:mmu:g4427 | 2.234726 | 0.842012 | 0.025622 | 0.049002 | Adgrg6 | 0.019535 | 1.591385 | 1.309782 |
| 3164 | rna:mmu:g24653 | 2.231622 | 18.894960 | 0.025673 | 0.049095 | Zfp13 | 0.000746 | 1.590526 | 1.308965 |
| 3166 | rna:mmu:g14160 | 2.227726 | 1.291074 | 0.026020 | 0.049725 | Gm9745 | 0.005965 | 1.584690 | 1.303425 |
| 3167 | rna:mmu:g36406 | 2.225970 | 19.748264 | 0.026049 | 0.049776 | Tigd4 | 0.000746 | 1.584204 | 1.302981 |
2671 rows × 9 columns
[29]:
expm.rna.nichenet(
    taxa = 'mmu',
    receiver = ['Neu'],
    sender = None,
    identity = 'cell.type',
    foreground = upreg['gene'].tolist(),
    background = None,
    expression_threshold = 0.001,
    ncpus = 20,
    key_added = 'nichenet'
)
[i] background gene set constructed with size 15993
[i] using user-specified foreground gene set of size 2671
[i] using 1200(all) potential ligands
[i] using 581 expressed receptors in receivers
━━━━━━━━━━━━━━━━━━ predicting ligand activities 1200 / 1200 (09:56 < 00:00)
[30]:
expm['rna'].uns['nichenet']['activities']
[30]:
| ligand | auroc | aupr | aupr.adj | pearson | |
|---|---|---|---|---|---|
| 941 | Csf2 | 0.595752 | 0.214262 | 0.078202 | 0.137546 |
| 234 | Clec4g | 0.596799 | 0.212559 | 0.076500 | 0.130687 |
| 405 | Selp | 0.599250 | 0.209284 | 0.073225 | 0.128783 |
| 788 | Ifng | 0.602421 | 0.208928 | 0.072869 | 0.126478 |
| 431 | Il4 | 0.605878 | 0.207946 | 0.071887 | 0.126003 |
| ... | ... | ... | ... | ... | ... |
| 943 | Cntn5 | 0.534744 | 0.151258 | 0.015199 | 0.038510 |
| 226 | Cd6 | 0.533018 | 0.150995 | 0.014936 | 0.037346 |
| 336 | Nptx2 | 0.527072 | 0.147502 | 0.011442 | 0.030330 |
| 931 | Elfn1 | 0.513617 | 0.139674 | 0.003615 | 0.009316 |
| 681 | Cklf | 0.502508 | 0.136178 | 0.000118 | 0.001379 |
1200 rows × 5 columns
[31]:
expm.rna.nichenet_infer_targets(
    key_nichenet = 'nichenet',
    ligands = 10,
    n_targets = 200
)
[32]:
fig = expm.rna.plot_nichenet_ligands(
    key_nichenet = 'nichenet',
    figsize = (10, 2.2),
    width_ratios = [0.2, 8]
)