Bulk ATAC-seq Analysis#
This notebook demonstrates how to process bulk ATAC-seq (Assay for Transposase-Accessible Chromatin with high-throughput sequencing) data that has already been aligned to a reference genome. The exprmat package supports two input formats:
BAM files (Binary Alignment/Map): The recommended format when available. BAM files store complete alignment information including:
Per-read mapping coordinates, CIGAR strings, and mapping qualities
Mate pair information for paired-end reads
Read sequences and quality scores
This enables the most accurate fragment analysis, duplicate removal, and quality filtering
BigWig files: A common format in public databases (e.g., ENCODE, Roadmap Epigenomics). BigWig stores per-base or per-bin signal values at reduced resolution. Important limitations:
Signal has been summarized/aggregated, losing individual read information
Sequence information (nucleotides) is entirely discarded
PCR duplicate removal and fragment length filtering are no longer possible
Only suitable when BAM files are unavailable
ATAC-seq Background#
ATAC-seq uses the Tn5 transposase to simultaneously fragment and tag accessible chromatin regions with sequencing adapters. Key properties:
Nucleosome-free regions (~50-180 bp fragments) represent open chromatin (promoters, enhancers)
Mono-nucleosomal fragments (~180-400 bp) represent nucleosome-occupied regions
The fragment size distribution is a key quality metric, with a characteristic ~10.4 bp periodicity reflecting DNA helical pitch
[1]:
%load_ext autoreload
%autoreload 2
[2]:
import exprmat as em

em.setwd('../../../data')
ver = em.version()
[i] exprmat 0.2.66 / exprmat-db 0.2.66
[i] os: posix (linux)  platform version: 6.8.0-90-generic
[i] loaded configuration from /home/data/yangz/.exprmatrc
[i] current working directory: /home/data/yangz/packages/exprmat/data
[i] current database directory: /home/data/yangz/packages/database (0.2.66)
[i] resident memory: 776.45 MiB
[i] virtual memory: 5.95 GiB
In this section, we first demonstrate how to load bulk ATAC-seq samples from BAM files into the exprmat experiment framework. The data source directory is inspected to confirm the file structure.
[3]:
! tree -sh ./atac
[4.0K]  ./atac
├── [2.3G]  control-1.bam
├── [2.3M]  control-1.bam.bai
├── [148M]  control-1.fragments.tsv.gz
├── [2.3G]  control-1.sample.bam
├── [2.7G]  control-2.bam
├── [2.3M]  control-2.bam.bai
├── [178M]  control-2.fragments.tsv.gz
├── [2.7G]  control-2.sample.bam
├── [2.3G]  control-3.bam
├── [2.3M]  control-3.bam.bai
├── [149M]  control-3.fragments.tsv.gz
├── [2.3G]  control-3.sample.bam
├── [2.1G]  hp-1.bam
├── [2.3M]  hp-1.bam.bai
├── [137M]  hp-1.fragments.tsv.gz
├── [2.1G]  hp-1.sample.bam
├── [2.3G]  hp-2.bam
├── [2.4M]  hp-2.bam.bai
├── [150M]  hp-2.fragments.tsv.gz
├── [2.3G]  hp-2.sample.bam
├── [2.0G]  hp-3.bam
├── [2.3M]  hp-3.bam.bai
├── [134M]  hp-3.fragments.tsv.gz
└── [2.1G]  hp-3.sample.bam

1 directory, 24 files
[3]:
meta = em.metadata(
    locations    = [
        'atac/control-1.bam',
        'atac/control-2.bam',
        'atac/control-3.bam',
        'atac/hp-1.bam',
        'atac/hp-2.bam',
        'atac/hp-3.bam',
    ],
    modality     = ['atac-bulk'] * 6,
    default_taxa = ['hsa/grch38'] * 6,
    batches      = ['b-1'] * 6,
    names        = ['c1', 'c2', 'c3', 'e1', 'e2', 'e3'],
    groups       = ['control', 'control', 'control', 'expm', 'expm', 'expm'],
)
Each ATAC-seq sample requires one row in the metadata table with modality='atac-bulk'. The genome assembly version used for read alignment is critical — different assemblies (e.g., GRCh38 vs GRCh37 for human) have different coordinate systems, making cross-assembly comparisons invalid. The assembly is specified after the species name separated by / (e.g., hsa/grch38).
Available assemblies: The exprmat database ships multiple reference assemblies. For example, mouse genomes include both grcm38 (based on mm10) and grcm39 (based on mm39). Always use the assembly matching your alignment pipeline.
The metadata table also assigns biological groups (control vs expm) for downstream differential analysis, and batch identifiers to account for technical variation.
[4]:
meta.dataframe
[4]:
| location | sample | batch | group | modality | taxa | |
|---|---|---|---|---|---|---|
| 0 | atac/control-1.bam | c1 | b-1 | control | atac-bulk | hsa/grch38 |
| 1 | atac/control-2.bam | c2 | b-1 | control | atac-bulk | hsa/grch38 |
| 2 | atac/control-3.bam | c3 | b-1 | control | atac-bulk | hsa/grch38 |
| 3 | atac/hp-1.bam | e1 | b-1 | expm | atac-bulk | hsa/grch38 |
| 4 | atac/hp-2.bam | e2 | b-1 | expm | atac-bulk | hsa/grch38 |
| 5 | atac/hp-3.bam | e3 | b-1 | expm | atac-bulk | hsa/grch38 |
[5]:
expm = em.experiment(meta, dump = 'expm/bk-atac')
[i] reading sample c1 [atac-bulk] ...
[i] reading sample c2 [atac-bulk] ...
[i] reading sample c3 [atac-bulk] ...
[i] reading sample e1 [atac-bulk] ...
[i] reading sample e2 [atac-bulk] ...
[i] reading sample e3 [atac-bulk] ...
The bulk ATAC-seq data is stored in an automatically generated atac modality object. Note that its .var (feature/variable) count is initially 0 — this is by design for compatibility with the single-cell ATAC data format. For scATAC-seq, the expression matrix is typically a bin count matrix (genome tiled into bins). However, for bulk ATAC-seq, constructing such a matrix genome-wide is not meaningful. Instead, we work directly with BAM-derived fragment information and only construct a
peak-based matrix later (see the “Peak Matrix” section below).
[3]:
expm = em.load_experiment('expm/bk-atac')
━━━━━━━━━━━━━━━━━━━━━━━━━━ loading samples 1 / 1 (00:01 < 00:00)
[!] integrated mudata object is not generated.
[6]:
print(expm)
[!] dataset not integrated.
[*] composed of samples:
  bulk-atac   atac  hsa    batch autogen   of size 6 × 0
[8]:
expm.atac['bulk-atac'].obs
[8]:
| n.fragments | pct.dup | pct.mito | location | sample | batch | group | modality | taxa | |
|---|---|---|---|---|---|---|---|---|---|
| bulk-atac:c1 | 25596750 | 0.000264 | 0.0 | atac/control-1.bam | c1 | b-1 | control | atac-bulk | hsa/grch38 |
| bulk-atac:c2 | 29933508 | 0.000356 | 0.0 | atac/control-2.bam | c2 | b-1 | control | atac-bulk | hsa/grch38 |
| bulk-atac:c3 | 26024477 | 0.000272 | 0.0 | atac/control-3.bam | c3 | b-1 | control | atac-bulk | hsa/grch38 |
| bulk-atac:e1 | 24406481 | 0.000328 | 0.0 | atac/hp-1.bam | e1 | b-1 | expm | atac-bulk | hsa/grch38 |
| bulk-atac:e2 | 26010889 | 0.000294 | 0.0 | atac/hp-2.bam | e2 | b-1 | expm | atac-bulk | hsa/grch38 |
| bulk-atac:e3 | 23710917 | 0.000301 | 0.0 | atac/hp-3.bam | e3 | b-1 | expm | atac-bulk | hsa/grch38 |
[19]:
expm.atac._init_atac(run_on_samples = expm.all_samples('atac'))
[23]:
expm.atac.view('bulk-atac')
annotated data of size 6 × 0
    obs : n.fragments <ui64> <i> pct.dup <f64> <f> pct.mito <f64> <f> location <o> <o/location>
          sample <o> <c/sample> batch <o> <c/batch> group <o> <c> modality <o> <c/modality>
          taxa <o> <c/taxa>
   obsm : paired <csr:ui32(3088286401)> <fragments>
    uns : assembly.size <asm-size> assembly <assembly>
[3]:
expm = em.load_experiment('expm/bk-atac')
━━━━━━━━━━━━━━━━━━━━━━━━━━ loading samples 3 / 3 (00:01 < 00:00)
[!] integrated mudata object is not generated.
ATAC-seq Quality Control#
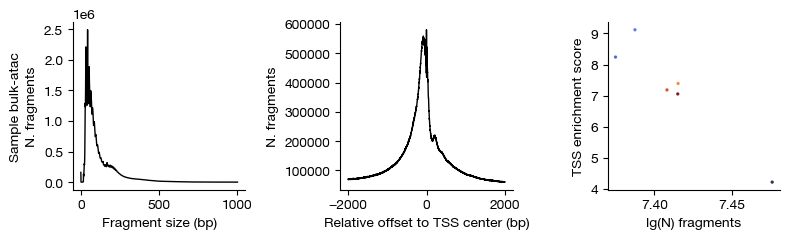
Before downstream analysis, we assess the quality of each ATAC-seq sample using the same visualization tools available for single-cell ATAC data. Key QC metrics include:
Fragment size distribution: A healthy ATAC-seq library shows a characteristic pattern with peaks at ~50 bp (nucleosome-free), ~200 bp (mono-nucleosome), ~400 bp (di-nucleosome), etc.
TSS enrichment score: Measures signal enrichment at transcription start sites relative to flanking regions. High TSS enrichment (>5-10) indicates good signal-to-noise.
Fraction of reads in peaks (FRiP): The proportion of reads overlapping called peaks. Typically 10-30% for high-quality bulk ATAC-seq.
Duplication rate: High duplication rates (>50%) may indicate PCR over-amplification or low starting material.
[24]:
figs = expm.atac.plot_qc(run_on_samples = True)
[25]:
expm.atac.view('bulk-atac')
annotated data of size 6 × 0
    obs : n.fragments <ui64> <i> pct.dup <f64> <f> pct.mito <f64> <f> location <o> <o/location>
          sample <o> <c/sample> batch <o> <c/batch> group <o> <c> modality <o> <c/modality>
          taxa <o> <c/taxa> tsse <f64> <f/tsse>
   obsm : paired <csr:ui32(3088286401)> <fragments>
    uns : assembly.size <asm-size> assembly <assembly> frag.sizes <frag-size> tsse <overall-tsse>
          pct.tss.overlap <tss-overlap> tss.profile <tss-profile>
Peak Calling#
For bulk ATAC-seq data, we do not need unsupervised clustering (unlike scATAC-seq). Instead, we directly call peaks — regions of significant chromatin accessibility — on each group of samples. The peak calling procedure:
Aggregates fragment alignments across all samples within each group
Uses MACS2-style algorithms to identify regions with significantly more signal than the local background
Controls the false discovery rate via the q-value threshold
Exports peak tables per group into the
.unsslot of the ATAC modality
Key parameter: ``max_frag_size=180`` — We restrict peak calling to nucleosome-free fragments (≤180 bp), which represent true open chromatin regions. Longer fragments include nucleosomal DNA and would blur the signal.
The groupby='group' parameter tells the function to call peaks separately for each biological group (control and experimental), producing group-specific peak sets.
[26]:
expm.atac.call_peaks_fragments(
    run_on_samples = ['bulk-atac'],

    # call peaks from fragments
    groupby = 'group',
    qvalue = 0.05,
    call_broad_peaks = False,
    broad_cutoff = 0.1,
    replicate = 'sample',
    replicate_qvalue = None,
    max_frag_size = 180,  # only call nucleosome-free fragments
    selections = None,
    nolambda = False,
    shift = -100,
    extsize = 200,
    min_len = None,
    blacklist = None,

    # directly call groups of peaks
    key_added = 'peaks.group',
    inplace = True,
    n_jobs = 8
)
[i] exporting fragments ...
[i] calling peaks ...
[14]:
expm.atac.view('bulk-atac')
annotated data of size 6 × 0
    obs : n.fragments <ui64> <i> pct.dup <f64> <f> pct.mito <f64> <f> location <o> <o/location>
          sample <o> <c/sample> batch <cat> <c/batch> group <cat> <c> modality <cat> <c/modality>
          taxa <cat> <c/taxa> tsse <f64> <f/tsse>
   obsm : paired <csr:ui32(3088286401)> <fragments>
    uns : assembly <assembly> assembly.size <asm-size> frag.sizes <frag-size>
          pct.tss.overlap <tss-overlap> peaks.group <dict/peaks/grouped-peaks>
          peaks.merged <dict/peaks/merged-peaks> tss.profile <tss-profile> tsse <overall-tsse>
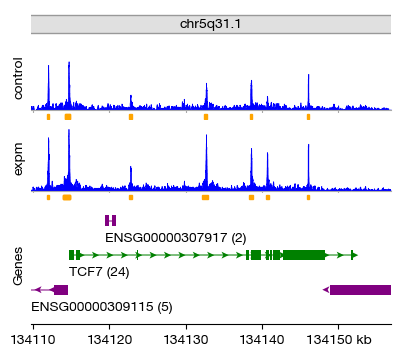
We can visualize the called peaks in a genome browser-style track plot. The plot_atac_peaks() function generates a composite figure showing:
Coverage tracks per group: The aggregated read depth for control and experimental samples
Peak annotation track: The called peak intervals for each group
Gene track: Reference gene annotations for the selected region
Chromosome ideogram: The genomic context
Here we visualize peaks around the TCF7 gene locus (a T-cell transcription factor), using a ±5 kb window around the gene body. The peak annotation track shows clear differences between control and experimental groups in the TCF7 promoter/enhancer regions.
[5]:
figs = expm.atac.plot_peaks(
    run_on_samples = ['bulk-atac'],
    group_key = 'group', peaks_key = 'peaks.group',
    # either specifying a gene name for convenience
    gene = 'TCF7', upstream = 5000, downstream = 5000,
    # or specify chromosome coordinates manually
    chr = None, xf = None, xt = None,
    figsize = (4, 3.5), dpi = 100,
    gene_track_height = 0.4, chrom_track_height = 0.10,
    peak_annotation_height = 0.1,
    min_frag_length = None, max_frag_length = 180,
    title = None, showgn = True,

    do_tight_layout = False
)
Before constructing the peak-by-sample count matrix, we need to establish a consensus peak set — the intersection of peaks identified across all groups. This step, called peak merging, reconciles peak coordinates from different groups into a unified set of intervals that can be used for count quantification across all samples.
IDR-based Peak Merging (ENCODE Standard)#
IDR (Irreproducible Discovery Rate) is the ENCODE-recommended method for merging peaks from bulk ATAC-seq and ChIP-seq experiments. The IDR approach:
Takes replicate peak calls and ranks them by statistical significance
Evaluates the consistency of peak rankings across replicates
Identifies the set of peaks that are consistently reproducible above a specified rank threshold
This method is particularly useful when you have biological replicates, as it ensures only reproducible peaks are retained. The flavor='idr' parameter selects this method, which internally uses the idr Python package (a port of the original ENCODE IDR tool).
[4]:
expm.atac.merge_peaks_fragments(
    run_on_samples = ['bulk-atac'],
    key_added = 'peaks.merged',
    key_groups = 'peaks.group',
    flavor = 'idr'
)
[i] merging peaks ...
[i] ranking peaks ...
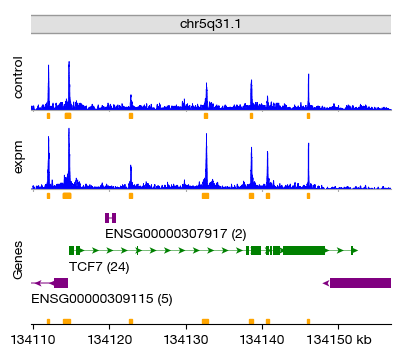
We inspect the merged consensus peaks stored in .uns['peaks.merged']. This DataFrame contains the genomic coordinates (chromosome, start, end) of all consensus peaks. The merged peaks are also plotted at the bottom of the locus view — these represent the union of reproducible open chromatin regions across all groups.
[5]:
expm.atac['bulk-atac'].uns['peaks.merged']
[5]:
| chr | start | end | strand | score | fc | p | q | summit | signal.x | signal.y | |
|---|---|---|---|---|---|---|---|---|---|---|---|
| 0 | chr20 | 2101614 | 2103533 | . | 1025 | 7.587683 | 63.241371 | 60.665310 | 457 | 419.0 | 606.0 |
| 1 | chr19 | 47273238 | 47275238 | . | 481 | 4.275474 | 37.156929 | 34.723652 | 383 | 134.0 | 347.0 |
| 2 | chr5 | 138464000 | 138466031 | . | 1158 | 9.895336 | 626.924805 | 623.349915 | 196 | 158.0 | 1000.0 |
| 3 | chr20 | 33993010 | 33994675 | . | 2000 | 22.268004 | 849.103821 | 845.262634 | 222 | 1000.0 | 1000.0 |
| 4 | chr3 | 9396141 | 9397827 | . | 2000 | 6.767930 | 162.998184 | 160.120667 | 206 | 1000.0 | 1000.0 |
| ... | ... | ... | ... | ... | ... | ... | ... | ... | ... | ... | ... |
| 44503 | chr4 | 15786800 | 15787259 | . | 55 | 2.565707 | 7.645530 | 5.579120 | 199 | NaN | NaN |
| 44504 | chr8 | 63179767 | 63180248 | . | 54 | 3.018109 | 7.620480 | 5.465224 | 241 | NaN | NaN |
| 44505 | chr9 | 97154891 | 97155469 | . | 52 | 3.000378 | 7.368090 | 5.221102 | 449 | NaN | NaN |
| 44506 | chr5 | 37519258 | 37519720 | . | 50 | 2.879079 | 7.138310 | 5.003808 | 221 | NaN | NaN |
| 44507 | chr18 | 2604253 | 2604589 | . | 47 | 2.528090 | 6.743580 | 4.706681 | 135 | NaN | NaN |
44508 rows × 11 columns
[6]:
expm.atac.view('bulk-atac')
annotated data of size 6 × 0
    obs : n.fragments <ui64> <i> pct.dup <f64> <f> pct.mito <f64> <f> location <o> <o/location>
          sample <o> <c/sample> batch <cat> <c/batch> group <cat> <c> modality <cat> <c/modality>
          taxa <cat> <c/taxa> tsse <f64> <f/tsse>
   obsm : paired <csr:ui32(3088286401)> <fragments>
    uns : assembly <assembly> assembly.size <asm-size> frag.sizes <frag-size>
          pct.tss.overlap <tss-overlap> peaks.group <dict/peaks/merged-peaks>
          peaks.merged <dict/peaks/merged-peaks> tss.profile <tss-profile> tsse <overall-tsse>
[16]:
figs = expm.atac.plot_peaks(
    run_on_samples = ['bulk-atac'],
    group_key = 'group', peaks_key = 'peaks.group',
    # either specifying a gene name for convenience
    gene = 'TCF7', upstream = 5000, downstream = 5000,
    # or specify chromosome coordinates manually
    chr = None, xf = None, xt = None,
    figsize = (4, 3.5), dpi = 100,
    gene_track_height = 0.4, chrom_track_height = 0.10,
    peak_annotation_height = 0.1,
    min_frag_length = None, max_frag_length = 180,
    plot_consensus_peak = 'peaks.merged',
    title = None, showgn = True,
    do_tight_layout = False
)
SnapATAC-based Peak Merging#
SnapATAC provides an efficient alternative algorithm for peak merging. Originally designed for single-cell ATAC-seq data, it works equally well for bulk data. The algorithm:
Takes peak centers from all groups
Merges peaks whose centers are within
half_widthbase pairs of each otherUses a greedy merging strategy: iteratively merges overlapping intervals
Produces a consensus set with the merge resolution controlled by
half_width(default: 250 bp)
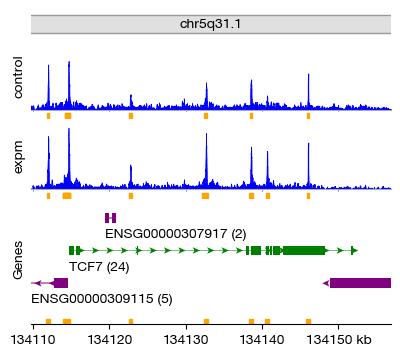
This method is computationally efficient and produces comparable results to IDR when replicates are of good quality. The half_width parameter determines how close two peak summits need to be to be merged — smaller values produce more refined boundaries, larger values produce broader consensus regions.
[17]:
expm.atac.merge_peaks_fragments(
    run_on_samples = ['bulk-atac'],
    key_added = 'peaks.merged',
    key_groups = 'peaks.group',
    flavor = 'snapatac',
    half_width = 250
)
[18]:
expm.atac['bulk-atac'].uns['peaks.merged']
[18]:
| expm | control | chr | start | end | strand | summit | |
|---|---|---|---|---|---|---|---|
| 0 | True | True | chr1 | 9853 | 10354 | . | 250 |
| 1 | True | True | chr1 | 15983 | 16484 | . | 250 |
| 2 | True | True | chr1 | 181228 | 181729 | . | 250 |
| 3 | True | True | chr1 | 180549 | 181050 | . | 250 |
| 4 | True | True | chr1 | 191240 | 191741 | . | 250 |
| ... | ... | ... | ... | ... | ... | ... | ... |
| 48514 | False | True | chrY | 56706793 | 56707294 | . | 250 |
| 48515 | True | True | chrY | 56727895 | 56728396 | . | 250 |
| 48516 | True | True | chrY | 56734538 | 56735039 | . | 250 |
| 48517 | True | True | chrY | 56742463 | 56742964 | . | 250 |
| 48518 | True | True | chrY | 56763268 | 56763769 | . | 250 |
48519 rows × 7 columns
[19]:
expm.atac.view('bulk-atac')
annotated data of size 6 × 0
    obs : n.fragments <ui64> <i> pct.dup <f64> <f> pct.mito <f64> <f> location <o> <o/location>
          sample <o> <c/sample> batch <cat> <c/batch> group <cat> <c> modality <cat> <c/modality>
          taxa <cat> <c/taxa> tsse <f64> <f/tsse>
   obsm : paired <csr:ui32(3088286401)> <fragments>
    uns : assembly <assembly> assembly.size <asm-size> frag.sizes <frag-size>
          pct.tss.overlap <tss-overlap> peaks.group <dict/peaks/grouped-peaks>
          peaks.merged <dict/peaks/merged-peaks> tss.profile <tss-profile> tsse <overall-tsse>
[ ]:
figs = expm.atac.plot_peaks(
    run_on_samples = ['bulk-atac'], group_key = 'group', peaks_key = 'peaks.group',
    # either specifying a gene name for convenience
    gene = 'TCF7', upstream = 5000, downstream = 5000,
    # or specify chromosome coordinates manually
    chr = None, xf = None, xt = None,
    figsize = (4, 3.5), dpi = 100,
    gene_track_height = 0.4, chrom_track_height = 0.10,
    peak_annotation_height = 0.1,
    min_frag_length = None, max_frag_length = 180,
    plot_consensus_peak = 'peaks.merged',
    title = None, showgn = True
)
Peak Matrix Construction and Gene Activity Inference#
In the final processing step, we perform two critical operations:
Peak-by-Sample Count Matrix (atac-peak modality)#
We count the number of transposition events (Tn5 insertion sites) that fall within each consensus peak for each sample. This process:
Counts only paired-end insertions (both read1 and read2 start sites), which represent true Tn5 cutting events
Filters fragments to the nucleosome-free range (≤180 bp)
Uses a chunked approach (
chunk_size=500) for memory efficiencyAutomatically creates a new modality named
atac-p(ATAC peaks), where observations are samples and variables are peaks
2. Gene Activity Matrix#
Chromatin accessibility at promoters and gene bodies can be used to estimate transcriptional activity. This inference:
Maps each gene to its promoter region (±2 kb around TSS)
Sums the accessibility signal within those regions
Produces an inferred gene expression matrix (simulated
rnamodality)This inferred matrix can be used for integration with RNA-seq data, enabling cross-modality comparisons
ATAC-seq gene activity inference is based on the observation that open chromatin at promoters strongly correlates with gene expression, though the relationship is indirect and promoter-proximal accessibility is only one of many regulatory mechanisms.
[23]:
expm.atac.make_peak_matrix_fragments(
    run_on_samples = ['bulk-atac'],
    chunk_size = 500,
    min_frag_size = None,
    max_frag_size = 180,
    counting_strategy = 'paired-insertion',
    value_type = 'target',
    summary_type = 'sum'
)
[i] created subset [bulk-atac] from sample [bulk-atac]
[24]:
expm.atac_peak['bulk-atac'].var
[24]:
| expm | control | chr | start | end | strand | summit | |
|---|---|---|---|---|---|---|---|
| peak:grch38:chr1:9853-10354 | True | True | chr1 | 9853 | 10354 | . | 250 |
| peak:grch38:chr1:15983-16484 | True | True | chr1 | 15983 | 16484 | . | 250 |
| peak:grch38:chr1:181228-181729 | True | True | chr1 | 181228 | 181729 | . | 250 |
| peak:grch38:chr1:180549-181050 | True | True | chr1 | 180549 | 181050 | . | 250 |
| peak:grch38:chr1:191240-191741 | True | True | chr1 | 191240 | 191741 | . | 250 |
| ... | ... | ... | ... | ... | ... | ... | ... |
| peak:grch38:chrY:56706793-56707294 | False | True | chrY | 56706793 | 56707294 | . | 250 |
| peak:grch38:chrY:56727895-56728396 | True | True | chrY | 56727895 | 56728396 | . | 250 |
| peak:grch38:chrY:56734538-56735039 | True | True | chrY | 56734538 | 56735039 | . | 250 |
| peak:grch38:chrY:56742463-56742964 | True | True | chrY | 56742463 | 56742964 | . | 250 |
| peak:grch38:chrY:56763268-56763769 | True | True | chrY | 56763268 | 56763769 | . | 250 |
48519 rows × 7 columns
[30]:
expm.atac_peak.view('bulk-atac')
annotated data of size 6 × 48519
    obs : n.fragments <ui64> <i> pct.dup <f64> <f> pct.mito <f64> <f> location <o> <o/location>
          sample <o> <c/sample> batch <cat> <c/batch> group <cat> <c> modality <cat> <c/modality>
          taxa <cat> <c/taxa> tsse <f64> <f/tsse>
    var : expm <bool> <bool> control <bool> <bool> chr <o> <c/chromosome> start <i64> <i>
          end <i64> <i> strand <o> <o/strand> summit <i64> <i>
    uns : assembly <assembly> assembly.size <asm-size>
Remove peaks with very low total accessibility across all samples. The min_sum=3 threshold discards peaks whose summed count across all samples is less than 3. This aggressive filtering step:
Eliminates noisy, poorly-represented peaks
Reduces the multiple testing burden in downstream differential analysis
Focuses analysis on robustly detected open chromatin regions
[32]:
expm.atac_peak.filter_genes_by_sum(run_on_samples = ['bulk-atac'], min_sum = 3)
[33]:
print(expm)
[!] dataset not integrated.
[*] composed of samples:
  bulk-atac   atac      hsa    batch autogen   of size 6 × 0
  bulk-atac   atac-peak hsa    batch autogen   of size 6 × 48519
Save the Processed Dataset#
All changes made to the experiment — including QC filters, peak calls, merged peaks, peak matrix, and gene activity matrix — are persisted to disk. The experiment can later be reloaded with em.load_experiment('bk-atac') without repeating any of the preprocessing steps.
[34]:
expm.save()
[i] saving individual samples. (pass `save_samples = False` to skip)
   ━━━━━━━━━━━━━━━━━━━━━━━━━━ modality [atac]          1 / 1     (00:03 < 00:00)
   ━━━━━━━━━━━━━━━━━━━━━━━━━━ modality [atac-peak]     1 / 1     (00:00 < 00:00)