CITE-seq and Antibody Tags#
Cellular Indexing of Transcriptomes and Epitopes by Sequencing (CITE-seq) enables simultaneous measurement of RNA expression and cell surface protein abundance in individual cells using oligonucleotide-conjugated antibodies. This multimodal approach bridges the gap between transcriptomic and proteomic profiling, providing both the breadth of scRNA-seq gene discovery and the specificity of antibody-based protein detection. This notebook demonstrates CITE-seq analysis using the exprmat package, covering the processing of antibody-derived tag (ADT) counts, normalization and denoising of protein measurements, integration of ADT and RNA modalities for clustering and visualization, and the use of surface protein markers for precise cell type identification.
[1]:
%load_ext autoreload
%autoreload 2
[2]:
import exprmat as em
# set working directory
em.setwd('../../../data')
ver = em.version()
[i] exprmat 0.2.66 / exprmat-db 0.2.66
[i] os: posix (linux)  platform version: 6.8.0-90-generic
[i] loaded configuration from /home/data/yangz/.exprmatrc
[i] current working directory: /home/data/yangz/packages/exprmat/data
[i] current database directory: /home/data/yangz/packages/database (0.2.66)
[i] resident memory: 776.09 MiB
[i] virtual memory: 5.95 GiB
The following data presents a 112-plex CITE-seq dataset sampled from mouse bone marrow cells, sorted to enrich specific cell populations: Lin⁻ Sca-1⁺ cKit⁺ (LSK, enriched for hematopoietic stem cells), IL7Rα⁺ (enriched for lymphoid cells), and cKit⁺ (enriched for myeloid cells). Here, we create a metadata table for it.
[3]:
meta = em.metadata(
    # two samples from a murine tumor infiltrating cd8+ t cell dataset.
    locations    = [
        'scrna/bm-112-plex/hsc-mpp.h5',
        'scrna/bm-112-plex/il7ra-pos.h5',
        'scrna/bm-112-plex/kit-pos-1.h5',
        'scrna/bm-112-plex/kit-pos-2.h5',
        'scrna/bm-112-plex/kit-pos-3.h5'
    ],
    modality     = ['cite'] * 5,
    default_taxa = ['mmu'] * 5,
    batches      = ['b-1', 'b-2', 'b-3', 'b-4', 'b-5'],
    names        = ['hsc-mpp', 'il7ra', 'kit-1', 'kit-2', 'kit-3'],
    groups       = ['hsc', 'il7ra', 'kit', 'kit', 'kit']
)
As can be seen, the standard 10X H5 format contains both RNA and surface protein data. We set the modality name to cite.
[4]:
meta.dataframe
[4]:
| location | sample | batch | group | modality | taxa | |
|---|---|---|---|---|---|---|
| 0 | scrna/bm-112-plex/hsc-mpp.h5 | hsc-mpp | b-1 | hsc | cite | mmu |
| 1 | scrna/bm-112-plex/il7ra-pos.h5 | il7ra | b-2 | il7ra | cite | mmu |
| 2 | scrna/bm-112-plex/kit-pos-1.h5 | kit-1 | b-3 | kit | cite | mmu |
| 3 | scrna/bm-112-plex/kit-pos-2.h5 | kit-2 | b-4 | kit | cite | mmu |
| 4 | scrna/bm-112-plex/kit-pos-3.h5 | kit-3 | b-5 | kit | cite | mmu |
[5]:
expm = em.experiment(meta, dump = 'expm/cite')
[i] reading sample hsc-mpp [cite] ...
[i] 368 genes (out of 28692) not in the reference gene list.
[i] total 28324 genes mapped. 28260 unique genes.
[i] reading sample il7ra [cite] ...
[i] 368 genes (out of 28692) not in the reference gene list.
[i] total 28324 genes mapped. 28260 unique genes.
[i] reading sample kit-1 [cite] ...
[i] 368 genes (out of 28692) not in the reference gene list.
[i] total 28324 genes mapped. 28260 unique genes.
[i] reading sample kit-2 [cite] ...
[i] 368 genes (out of 28692) not in the reference gene list.
[i] total 28324 genes mapped. 28260 unique genes.
[i] reading sample kit-3 [cite] ...
[i] 368 genes (out of 28692) not in the reference gene list.
[i] total 28324 genes mapped. 28260 unique genes.
It can be observed that the program automatically splits the original H5 file into RNA and surface protein modalities, as they require different processing workflows.
[6]:
print(expm)
[!] dataset not integrated.
[*] composed of samples:
  hsc-mpp   cite  mmu    batch b-1     of size 9868 × 112
  il7ra     cite  mmu    batch b-2     of size 11277 × 112
  kit-1     cite  mmu    batch b-3     of size 13837 × 112
  kit-2     cite  mmu    batch b-4     of size 11035 × 112
  kit-3     cite  mmu    batch b-5     of size 11568 × 112
  hsc-mpp   rna   mmu    batch b-1     of size 9868 × 28260
  il7ra     rna   mmu    batch b-2     of size 11277 × 28260
  kit-1     rna   mmu    batch b-3     of size 13837 × 28260
  kit-2     rna   mmu    batch b-4     of size 11035 × 28260
  kit-3     rna   mmu    batch b-5     of size 11568 × 28260
RNA Modality Quality Control#
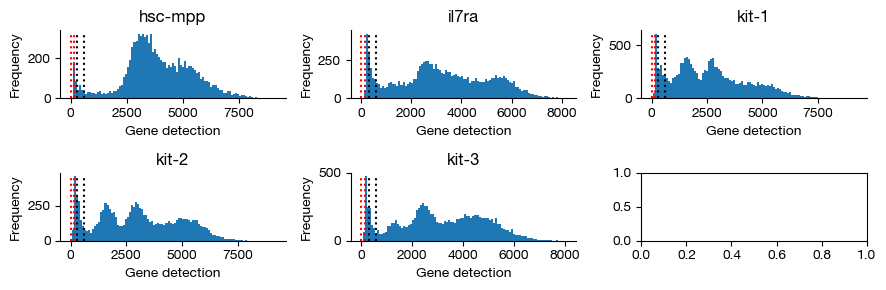
We perform quality control on the RNA modality following the standard protocol.
[7]:
expm.rna.qc(
    run_on_samples = True,
    mt_seqid = 'chrM',
    mt_percent = 0.15,
    ribo_genes = None,
    ribo_percent = None,
    outlier_mode = 'mads',
    outlier_n = 5,
    doublet_method = 'no',
    min_cells = 3,
    min_genes = 50,
    parallel = 3
)
━━━━━━━━━━━━━━━━━━━━━━━━━━ processing samples 5 / 5 (00:13 < 00:00)
[8]:
gene_counts = expm.rna.plot_gene_histograms(ncols = 3, figsize = (9, 3))
[9]:
expm.rna.qc(
    run_on_samples = True,
    mt_seqid = 'chrM',
    mt_percent = 0.10,
    ribo_genes = None,
    ribo_percent = None,
    outlier_mode = 'mads',
    outlier_n = 5,
    doublet_method = 'scrublet',
    min_cells = 3,
    min_genes = 800
)
[i] found 13 mitochondrial genes (expected 13)
[i] found 115 ribosomal genes
quality controlling sample [hsc-mpp] ...
raw dataset contains 9868 cells, 18607 genes
[i] preprocessing observation count matrix ...
[i] simulating doublets ...
[i] embedding using pca ...
[i] calculating doublet scores ...
[i] detected doublet rate: 0.0 %
[i] estimated detectable doublet fraction: 0.6 %
[i] overall doublet rate: 2.1 %
filtered dataset contains 8770 cells, 16592 genes
[i] found 13 mitochondrial genes (expected 13)
[i] found 114 ribosomal genes
quality controlling sample [il7ra] ...
raw dataset contains 11277 cells, 18219 genes
[i] preprocessing observation count matrix ...
[i] simulating doublets ...
[i] embedding using pca ...
[i] calculating doublet scores ...
[i] detected doublet rate: 2.4 %
[i] estimated detectable doublet fraction: 55.9 %
[i] overall doublet rate: 4.4 %
filtered dataset contains 8458 cells, 16142 genes
[i] found 13 mitochondrial genes (expected 13)
[i] found 114 ribosomal genes
quality controlling sample [kit-1] ...
raw dataset contains 13837 cells, 18099 genes
[i] preprocessing observation count matrix ...
[i] simulating doublets ...
[i] embedding using pca ...
[i] calculating doublet scores ...
[i] detected doublet rate: 8.1 %
[i] estimated detectable doublet fraction: 74.2 %
[i] overall doublet rate: 10.9 %
filtered dataset contains 9869 cells, 15971 genes
[i] found 13 mitochondrial genes (expected 13)
[i] found 115 ribosomal genes
quality controlling sample [kit-2] ...
raw dataset contains 11035 cells, 18363 genes
[i] preprocessing observation count matrix ...
[i] simulating doublets ...
[i] embedding using pca ...
[i] calculating doublet scores ...
[i] detected doublet rate: 3.1 %
[i] estimated detectable doublet fraction: 57.0 %
[i] overall doublet rate: 5.4 %
filtered dataset contains 8782 cells, 16386 genes
[i] found 13 mitochondrial genes (expected 13)
[i] found 115 ribosomal genes
quality controlling sample [kit-3] ...
raw dataset contains 11568 cells, 18110 genes
[i] preprocessing observation count matrix ...
[i] simulating doublets ...
[i] embedding using pca ...
[i] calculating doublet scores ...
[i] detected doublet rate: 5.5 %
[i] estimated detectable doublet fraction: 68.5 %
[i] overall doublet rate: 8.0 %
filtered dataset contains 9224 cells, 16138 genes
[11]:
expm.save()

# filter rna modality, this will delete cells that do not pass qc criteria in the 'rna' modality data
# however, no changes will be applied to 'cite' modality
expm.rna.filter(run_on_samples = True)

# we need to dropped those cells in 'cite' manually
for sample in expm.modalities['rna'].keys():
    expm.modalities['cite'][sample] = expm.modalities['cite'][sample][
        expm.rna[sample].obs_names, :
    ].copy()
[i] saving individual samples. (pass `save_samples = False` to skip)
   ━━━━━━━━━━━━━━━━━━━━━━━━━━ modality [rna]           5 / 5     (00:03 < 00:00)
   ━━━━━━━━━━━━━━━━━━━━━━━━━━ modality [cite]          5 / 5     (00:00 < 00:00)
[12]:
expm.rna.log_normalize(
    run_on_samples = True,
    key_norm = 'norm',
    key_lognorm = 'lognorm'
)

expm.rna.select_hvg(
    run_on_samples = True,
    key_lognorm = 'lognorm',
    method = 'vst',
    dest = 'vst',
    n_top_genes = 1500
)

expm.merge(join = 'outer')
[13]:
print(expm)
annotated data of size 45103 × 17925
annotated data of size 45103 × 112
integrated dataset of size 45103 × 18037
contains modalities: rna, cite

 modality [rna]
    obs : sample <cat> <c/sample> batch <cat> <c/batch> group <cat> <c> modality <cat> <c/modality>
          taxa <cat> <c/taxa> barcode <o> <o> ubc <o> <o> n.umi <f64> <i> n.genes <i64> <i>
          n.mito <f64> <f> n.ribo <f64> <f> pct.mito <f64> <f> pct.ribo <f64> <f>
          filter <bool> <bool> score.doublet <f64> <f> score.doublet.se <f64> <f>
          is.doublet <bool> <bool> qc <bool> <bool/qc>
    var : chr <o> <c/chromosome> start <i64> <i> end <i64> <i> strand <o> <c/strand> id <o> <o>
          subtype <o> <c/gsubtype> gene <o> <o/gene> tlen <f64> <i/tlen> cdslen <i64> <i/cdslen>
          assembly <o> <c> uid <o> <o/ugene>
 layers : counts <f32> <i/counts>
    uns : slots <system>

 modality [cite]
    obs : sample <cat> <o> batch <cat> <o> group <cat> <o> modality <cat> <o> taxa <cat> <o>
          barcode <o> <o> ubc <o> <o>
    uns : slots <system>

[*] composed of samples:
  hsc-mpp   cite  mmu    batch b-1     of size 8770 × 112
  il7ra     cite  mmu    batch b-2     of size 8458 × 112
  kit-1     cite  mmu    batch b-3     of size 9869 × 112
  kit-2     cite  mmu    batch b-4     of size 8782 × 112
  kit-3     cite  mmu    batch b-5     of size 9224 × 112
  hsc-mpp   rna   mmu    batch b-1     of size 8770 × 16592
  il7ra     rna   mmu    batch b-2     of size 8458 × 16142
  kit-1     rna   mmu    batch b-3     of size 9869 × 15971
  kit-2     rna   mmu    batch b-4     of size 8782 × 16386
  kit-3     rna   mmu    batch b-5     of size 9224 × 16138
For reading convenience, we rename the CITE modality.
[14]:
expm['cite'].var_names = [
    'ag:CD62L', 'ag:CXCR3', 'ag:CD14', 'ag:SiglecF', 'ag:CX3CR1', 'ag:CD4',
    'ag:CD8a', 'ag:PD-1', 'ag:cKit', 'ag:Ly6C', 'ag:CD11b', 'ag:Ly6G',
    'ag:CD49f', 'ag:CD44', 'ag:CD54', 'ag:CD90.2', 'ag:CD73', 'ag:CD49d', 'ag:OX2',

    # isotype controls, mouse
    'iso:mIgG1', 'iso:mIgG2a', 'iso:mIgG2b',

    'ag:CD19', 'iso:rIgG2b', 'ag:CD45', 'ag:CD25', 'ag:B220', 'ag:CD102', 'ag:CD11c',
    'ag:CR1/2', 'ag:CD23', 'ag:CD16/32', 'ag:CD43', 'ag:CD5', 'ag:AA4.1',
    'ag:F4/80', 'ag:I-A/I-E', 'ag:NK1.1', 'ag:SiglecH', 'ag:Ter-119',
    'ag:SCA-1', 'ag:CD45.2', 'ag:CD45.1', 'ag:CD3', 'ag:PD-L1', 'ag:CD27',
    'ag:CD20', 'ag:GITR', 'ag:CD69', 'ag:CD86', 'ag:CD150', 'ag:CD24', 'ag:Itg7', 'ag:CD106',

    # isotype controls, rat
    'iso:rIgG1', 'iso:rIgG1.2', 'iso:rIgG2a', 'iso:rIgG2c',

    # isotype controls, armenian hamster
    'iso:ahIgG',

    'ag:LAG-3', 'ag:CD300LG', 'ag:CD163', 'ag:CD49b', 'ag:CD172a', 'ag:CD48',
    'ag:EPCR', 'ag:Siglec1', 'ag:CD71', 'ag:CD41', 'ag:IgM', 'ag:CD36', 'ag:CD38',
    'ag:DAF', 'ag:CD63', 'ag:CD79b', 'ag:CD301b', 'ag:TIM-4', 'ag:CD29', 'ag:IgD',
    'ag:CD140a', 'ag:CD11a', 'ag:ESAM', 'ag:OX2R', 'ag:CCR3', 'ag:PDCA1', 'ag:CD105',
    'ag:CD9', 'ag:CLEC12a', 'ag:CD22', 'ag:ST2', 'ag:Ly49A', 'ag:CD49a', 'ag:Ly38',
    'ag:PIR-A/B', 'ag:DPP-4', 'ag:HVEM', 'ag:CD2', 'ag:CD40', 'ag:CD31', 'ag:CD107a',
    'ag:CXCR2', 'ag:CD61', 'ag:Fas', 'ag:NKG2AB6', 'ag:Ly108', 'ag:CD85k', 'ag:CD51',
    'ag:CD205', 'ag:PVR', 'ag:CD81', 'ag:FLK2', 'ag:IL7Ra',
]

expm['cite'].var['antigen'] = expm['cite'].var_names.tolist()
expm['cite'].var['is.isotype'] = expm['cite'].var_names.str.startswith('iso:')

expm['cite'].var['gene'] = [
    'Sell', 'Cxcr3', 'Cd14', 'Siglecf', 'Cx3cr1', 'Cd4',
    'Cd8a', 'Pdcd1', 'Kit', 'Ly6c1:Ly6c2', 'Itgam', 'Ly6g',
    'Itga6', 'Cd44', 'Icam1', 'Thy1', 'Nt5e', 'Itga4', 'Cd200',

    # isotype controls, mouse
    'iso:mIgG1', 'iso:mIgG2a', 'iso:mIgG2b',

    'Cd19', 'iso:rIgG2b', 'Ptprc', 'Il2ra', 'Ptprc(R)', 'Icam2', 'Itgax',
    'Cr1l:Cr2', 'Fcer2a', 'Fcgr3:Fcgr2b', 'Spn', 'Cd5', 'Cd93',
    'Adgre1', 'H2-Aa', 'Klrb1c', 'Siglech', '?',
    'Ly6a:Ly6e', 'Ptprc^45.2', 'Ptprc^45.2', 'Cd3d:Cd3e:Cd3g', 'Cd274', 'Cd27',
    'Ms4a1', 'Tnfrsf18', 'Cd69', 'Cd86', 'Slamf1', 'Cd24a', 'Itga7', 'Vcam1',

    # isotype controls, rat
    'iso:rIgG1', 'iso:rIgG1.2', 'iso:rIgG2a', 'iso:rIgG2c',

    # isotype controls, armenian hamster
    'iso:ahIgG',

    'Lag3', 'Cd300lg', 'Cd163', 'Itga2', 'Sirpa', 'Cd48',
    'Procr', 'Siglec1', 'Tfrc', 'Itga2b', 'Ighm', 'Cd36', 'Cd38',
    'Cd55', 'Cd63', 'Cd79b', 'Mgl2', 'Timd4', 'Itgb1', 'Ighd',
    'Pdgfra', 'Itgal', 'Esam', 'Hcrtr2', 'Ccr3', 'Bst2', 'Eng',
    'Cd9', 'Clec12a', 'Cd22', 'Il1rl1', 'Klra1', 'Itga1', 'Cd1d',
    'Pirb:Pira*', 'Dpp4', 'Tnfrsf14', 'Cd2', 'Cd40', 'Pecam1', 'Lamp1',
    'Cxcr2', 'Itgb3', 'Fas', 'Klrc1', 'Slamf6', 'Lilrb4a', 'Itgav',
    'Ly75', 'Pvr', 'Cd81', 'Flt3', 'Il7r',
]
Now, we have synchronized and integrated the RNA and CITE datasets.
[15]:
print(expm)
annotated data of size 45103 × 17925
annotated data of size 45103 × 112
integrated dataset of size 45103 × 18037
contains modalities: rna, cite

 modality [rna]
    obs : sample <cat> <c/sample> batch <cat> <c/batch> group <cat> <c> modality <cat> <c/modality>
          taxa <cat> <c/taxa> barcode <o> <o> ubc <o> <o> n.umi <f64> <i> n.genes <i64> <i>
          n.mito <f64> <f> n.ribo <f64> <f> pct.mito <f64> <f> pct.ribo <f64> <f>
          filter <bool> <bool> score.doublet <f64> <f> score.doublet.se <f64> <f>
          is.doublet <bool> <bool> qc <bool> <bool/qc>
    var : chr <o> <c/chromosome> start <i64> <i> end <i64> <i> strand <o> <c/strand> id <o> <o>
          subtype <o> <c/gsubtype> gene <o> <o/gene> tlen <f64> <i/tlen> cdslen <i64> <i/cdslen>
          assembly <o> <c> uid <o> <o/ugene>
 layers : counts <f32> <i/counts>
    uns : slots <system>

 modality [cite]
    obs : sample <cat> <o> batch <cat> <o> group <cat> <o> modality <cat> <o> taxa <cat> <o>
          barcode <o> <o> ubc <o> <o>
    var : antigen <o> is.isotype <bool> gene <o>
    uns : slots <system>

[*] composed of samples:
  hsc-mpp   cite  mmu    batch b-1     of size 8770 × 112
  il7ra     cite  mmu    batch b-2     of size 8458 × 112
  kit-1     cite  mmu    batch b-3     of size 9869 × 112
  kit-2     cite  mmu    batch b-4     of size 8782 × 112
  kit-3     cite  mmu    batch b-5     of size 9224 × 112
  hsc-mpp   rna   mmu    batch b-1     of size 8770 × 16592
  il7ra     rna   mmu    batch b-2     of size 8458 × 16142
  kit-1     rna   mmu    batch b-3     of size 9869 × 15971
  kit-2     rna   mmu    batch b-4     of size 8782 × 16386
  kit-3     rna   mmu    batch b-5     of size 9224 × 16138
[16]:
expm.save(save_samples = False)
[i] main dataset write to expm/cite/integrated.h5mu
RNA-Based Visualization#
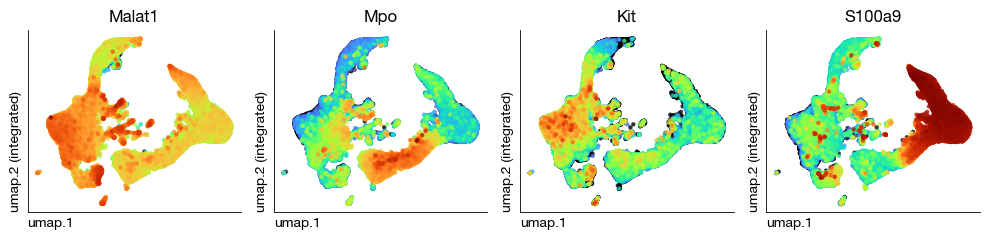
We first perform dimensionality reduction and visualization using only the RNA modality.
[17]:
expm.rna.select_hvg(
    key_lognorm = 'X',
    method = 'vst',
    dest = 'vst',
    batch_key = 'batch',
    n_top_genes = 3000
)
Here, cc-genes are previously collected mouse cell cycle-related genes. We exclude these genes to cluster based on cell identity.
[18]:
import pickle
with open('cc-genes.pkl', 'rb') as f:
    cc_genes = pickle.load(f)

lateral_names = [
    'Atad2', 'Blm', 'Brip1', 'Casp8ap2', 'Ccne2', 'Cdc45', 'Cdc6', 'Cdca7', 'Chaf1b', 'Clspn',
    'Dscc1', 'Dtl', 'E2f8', 'Exo1', 'Fen1', 'Gins2', 'Gmnn', 'Hells', 'Mcm2', 'Mcm4', 'Mcm5', 'Mcm6',
    'Msh2', 'Nasp', 'Pcna', 'Pola1', 'Pold3', 'Prim1', 'Rad51', 'Rad51ap1', 'Rfc2', 'Rpa2', 'Rrm1',
    'Rrm2', 'Slbp', 'Tipin', 'Tyms', 'Ubr7', 'Uhrf1', 'Ung', 'Usp1', 'Wdr76', 'Anln', 'Anp32e', 'Aurka', 'Aurkb',
    'Birc5', 'Bub1', 'Cbx5', 'Ccnb2', 'Cdc20', 'Cdc25c', 'Cdca2', 'Cdca3', 'Cdca8', 'Cdk1', 'Cenpa',
    'Cenpe', 'Cenpf', 'Ckap2', 'Ckap2l', 'Ckap5', 'Cks1b', 'Cks2', 'Ctcf', 'Dlgap5', 'Ect2',
    'G2e3', 'Gas2l3', 'Gtse1', 'Hjurp', 'Hmgb2', 'Hmmr', 'Kif11', 'Kif20b', 'Kif23', 'Kif2c', 'Lbr',
    'Mki67', 'Ncapd2', 'Ndc80', 'Nek2', 'Nuf2', 'Nusap1', 'Psrc1', 'Rangap1', 'Smc4', 'Tacc3',
    'Tmpo', 'Top2a', 'Tpx2', 'Ttk', 'Tubb4b', 'Ube2c', # cell cycle genes
    'Arhgap36', 'Rbm3', 'Sytl4', 'Malat1' # sex related genes
]

expm['rna'].var['vst.hvg'] = [
    x if gname not in lateral_names else False for x, gname in zip(
    expm['rna'].var['vst.hvg'], expm['rna'].var['gene']
)]

expm['rna'].var['vst.hvg'] = [
    x if gname not in cc_genes.tolist() else False for x, gname in zip(
    expm['rna'].var['vst.hvg'], expm['rna'].var.index
)]

expm['rna'].var['vst.hvg'].value_counts()
[18]:
vst.hvg
False    15301
True      2624
Name: count, dtype: int64
[ ]:
expm.rna.scvi(
    batch = 'batch', n_comps = 30,
    hvg = 'vst.hvg', key_counts = 'counts',
)
[20]:
expm.rna.knn(
    use_rep = 'scvi',
    n_comps = None,
    n_neighbors = 30,
    knn = True,
    method = "umap",
    transformer = None,
    metric = "cosine",
    metric_kwds = {},
    random_state = 42,
    key_added = 'nn',
    use_gpu = True
)

expm.rna.umap(
    min_dist = 0.3,
    spread = 1.5,
    n_components = 2,
    maxiter = None,
    alpha = 1,
    gamma = 1,
    negative_sample_rate = 5,
    init_pos = "spectral",
    random_state = 42,
    a = None, b = None,
    key_added = 'umap',
    neighbors_key = "nn"
)
[21]:
fig = expm.rna.plot_multiple_embedding(
    basis = 'umap', features = ['Malat1', 'Mpo', 'Kit', 'S100a9'], ncols = 4,
    sort = True, figsize = (10, 2.5), dpi = 100, legend_col = 2
)
CITE Modality Normalization#
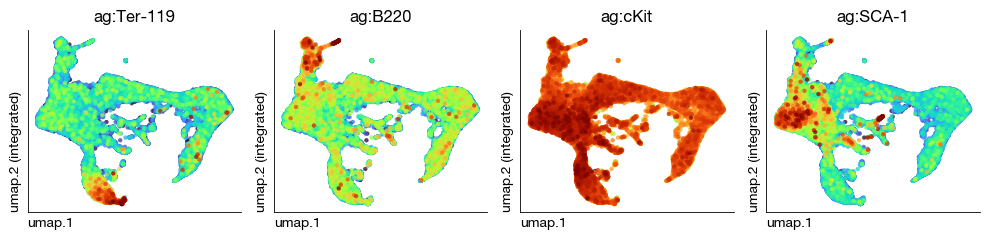
The CITE modality is typically normalized using centered log-ratio (CLR) transformation, rather than ordinary log normalization.
[ ]:
expm.cite.clr_normalize(
    key_source = 'X',
    key_added = 'clr'
)
We copy the RNA UMAP to the CITE modality.
[ ]:
expm['cite'].obsm['umap'] = expm['rna'].obsm['umap']
[ ]:
fig = expm.cite.plot_multiple_embedding(
    basis = 'umap', features = ['ag:Ter-119', 'ag:B220', 'ag:cKit', 'ag:SCA-1'], ncols = 4,
    sort = True, figsize = (10, 2.5), dpi = 100, legend_col = 2, cmap = 'turbo', remove_top = 50
)
Gating Strategy#
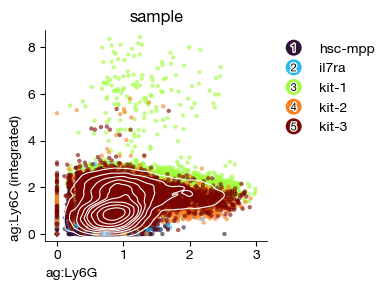
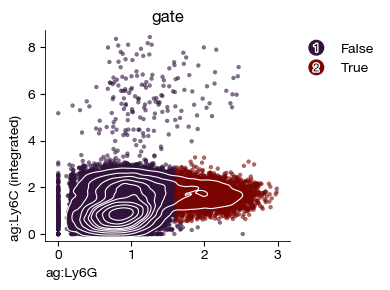
It is often desirable to have surface protein data display gating strategies similar to classical proteomics, although the two are not equivalent. This operation is most commonly used for surface protein lineage tracing or sample labeling, as the marker differences are very pronounced in these cases (e.g., Sample HashTags or CD45.1/2).
[ ]:
fig = expm.cite.plot_gene_gene(
    gene_x = 'ag:Ly6G', gene_y = 'ag:Ly6C',
    color = 'sample', alpha = 0.6, annotate = False,
    legend = True, legend_col = 1, annotate_style = 'text',
    contour_plot = True, contour_bw = 0.8, contour_default_color = 'white',
    figsize = (4, 3), dpi = 100,
    cmap = 'turbo',

    remove_zero_expression = False,
    scale = 'linear', arcsinh_divider = None
)
[ ]:
expm.cite.gate_polygon(
    gene_x = 'ag:Ly6G',
    gene_y = 'ag:Ly6C',
    layer = 'X',
    remove_zero_expression = False,
    scale = 'asis',
    arcsinh_divider = None,
    polygon = [(1.6, 0.5), (3.2, 0.5), (3.2, 3.5), (1.6, 3.5)],
    key_added = 'gate'
)
[ ]:
fig = expm.cite.plot_gene_gene(
    gene_x = 'ag:Ly6G', gene_y = 'ag:Ly6C',
    color = 'gate', alpha = 0.6, annotate = False,
    legend = True, legend_col = 1, annotate_style = 'text',
    contour_plot = True, contour_bw = 0.8, contour_default_color = 'white',
    figsize = (4, 3), dpi = 100,
    cmap = 'turbo',

    remove_zero_expression = False,
    scale = 'linear', arcsinh_divider = None
)
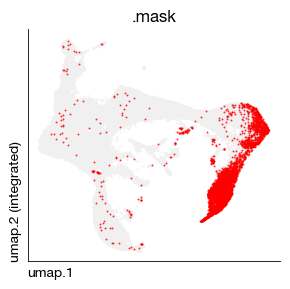
You can further display this subset on the original UMAP plot.
[ ]:
expm['rna'].obs['ly6g-hi'] = expm['cite'].obs['gate']
fig = expm.rna.plot_embedding_mask(
    basis = 'umap', color = 'ly6g-hi', values = ['True'],
    figsize = (3, 3), ptsize = 1.5
)
Saving the Dataset#
Save the integrated dataset.
[22]:
expm.save(save_samples = False)
[i] main dataset write to expm/cite/integrated.h5mu