Transcription Factor Activity Inference#
SCENIC+ provides method of TF target ranking based inference for activated or suppressed transcriptional factor from single cell expression
[1]:
%load_ext autoreload
%autoreload 2
[2]:
import exprmat as em
# set working directory
em.setwd('../../../data')
ver = em.version()
[i] exprmat 0.2.66 / exprmat-db 0.2.66
[i] os: posix (linux)  platform version: 6.8.0-90-generic
[i] loaded configuration from /home/data/yangz/.exprmatrc
[i] current working directory: /home/data/yangz/packages/exprmat/data
[i] current database directory: /home/data/yangz/packages/database (0.2.66)
[i] resident memory: 777.45 MiB
[i] virtual memory: 5.95 GiB
[3]:
expm = em.load_experiment('expm/scrna', load_samples = True, load_subset = 'mono-neutro')
━━━━━━━━━━━━━━━━━━━━━━━━━━ loading samples 5 / 5 (00:05 < 00:00)
[4]:
print(expm)
annotated data of size 9754 × 19651
subset mono-neutro of size 9754 × 19651
contains modalities: rna

 modality [rna]
    obs : sample <cat> <c/sample> batch <cat> <c/batch> group <cat> <c> modality <cat> <c/modality>
          taxa <cat> <c/taxa> barcode <o> <o> ubc <o> <o> n.umi <f64> <i> n.genes <i64> <i>
          n.mito <f64> <f> n.ribo <f64> <f> pct.mito <f64> <f> pct.ribo <f64> <f>
          filter <bool> <bool> score.doublet <f64> <f> score.doublet.se <f64> <f>
          is.doublet <bool> <bool> qc <bool> <bool/qc> leiden <cat> <c> sc3.5 <cat> <c>
          sc3.10 <cat> <c> sc3.20 <cat> <c> sc3.30 <cat> <c> cell.type <cat> <c>
          kde.umap <f64> <f/kde> psbulk <cat> <o> cytotrace.score <f64> <f>
          cytotrace.potency <cat> <o> cytotrace.relative <f64> <f> cytotrace.score.preknn <f64> <f>
          cytotrace.potency.preknn <cat> <o> ppt.pseudotime <f64> <f> ppt.seg <cat> <o>
          ppt.edge <cat> <o> ppt.milestones <cat> <o>
    var : chr <cat> <c/chromosome> start <i64> <i> end <i64> <i> strand <cat> <c/strand> id <o> <o>
          subtype <cat> <c/gsubtype> gene <cat> <o/gene> tlen <f64> <i/tlen> cdslen <i64> <i/cdslen>
          assembly <cat> <c> uid <o> <o/ugene> vst.hvg <bool> <bool/hvg> vst.all.means <f64> <f>
          vst.all.vars <f64> <f> vst.all.vars.norm <f64> <f> vst.all.hvg.rank <f32> <f>
          vst.all.hvg <bool> <bool>
 layers : counts <f32> <i/counts> magic <f64> <f/normal/imputed> norm <f32> <f>
   obsm : cnmf.10 <df> <f/embedding/usage> diffmap <arr:f32(5)> <f/embedding>
          harmony <arr:f32(35)> <f> knn <arr:i32(100)> <i/knni> knn.d <arr:f32(100)> <f/knnd>
          knn.d.nn30.diffmap <arr:f32(30)> <f> knn.nn30.diffmap <arr:i32(30)> <i>
          pca <arr:f64(35)> <f/embedding/pca> ppt <arr:f64(2000)> <ppt-assign>
          umap <arr:f32(2)> <f/embedding> umap.diff <arr:f32(2)> <f/embedding>
   varm : cnmf.10 <arr:f64(10)> <f/weights> cnmf.coef.10 <arr:f64(10)> <f/usage-coef>
          pca <arr:f64(35)> <f/weights>
   obsp : connectivities <csr:f32> <f/connectivity> connectivities.nn30.diffmap <csr:f32> <f>
          distances <csr:f32> <f/distance> distances.nn30.diffmap <csr:f32> <f>
    uns : cell.type.colors <o> cell.type_colors <o> cnmf <cnmf> cnmf.args <o>
          cnmf.density.10 <cnmf-density> cnmf.dist.10 <f/connectivity> cnmf.stats <cnmf-stats>
          commands <system> diffmap <o> kde.umap <kde-stats> leiden <o> leiden.colors <o>
          magic.errors <magic-errors> magic.t <magic-t> markers <markers> neighbors <knn>
          nn30.diffmap <knn> pca <dict> ppt <ppt> ppt.graph <o> ppt.milestones.colors <o>
          ppt.pseudotime <o> ppt.root <i> ppt.seg.colors <o> sc3.10.colors <o> sc3.20.colors <o>
          sc3.30.colors <o> sc3.5.colors <o> slots <system> trace <trace> umap <o> umap.diff <o>

[*] composed of samples:
  distal                rna   mmu    batch b1        of size 6451 × 21689
  niche                 rna   mmu    batch b2        of size 3656 × 21970
  normal                rna   mmu    batch b3        of size 4537 × 21917
  integrated-metacell   rna   autogen   batch autogen   of size 1277 × 18903
  psbulk                rna   autogen   batch autogen   of size 18 × 8928
SCENIC#
To obtain more stable result and reduce computation, running SCENIC on metacells is a good choice.
[5]:
expm.rna['integrated-metacell'].layers['counts'] = em.np.expm1(
    expm.rna['integrated-metacell'].X
).floor()
The calculation takes a long time. Due to the instability of jupyter kernels when executing long-time runs, we recommend running it in Python REPL
[7]:
expm.rna.infer_tf_activity(
    run_on_samples = ['integrated-metacell'],

    layer = 'counts',
    gene = 'gene',
    method = 'grnboost2',
    taxa = 'mmu',
    ncpus = 100,
    seed = 42,

    features = 'genes',
    cistromes = 'motifs',
    thresholds = [0.75, 0.90],
    top_n_targets = [50],
    top_n_regulators = [5, 10, 50],
    min_genes = 20,
    mask_dropout = True,
    keep_only_activating = True,
    rank_threshold = 5000,
    auc_threshold = 0.05,
    nes_threshold = 3.0,
    max_similarity_fdr = 0.001,
    min_orthologous_identity = 0,
    chunk_size = 100,

    weighted = False,

    key_adjacencies = 'tf.adjacencies',
    key_added = 'tf'
)
[i] loaded 1860 transcriptional factors.
[i] starting grnboost2 using 100 processes
━━━━━━━━━━━━━━━━━━━━━ inferring partial network 18903 / 18903 (56:56 < 00:00)
[i] finished in 3419.57559466362 seconds.
[i] calculating pearson correlations ...
[i] using 100 workers.
[i] creating regulons from a dataframe of enriched features.
[i] additional columns saved: []
━━━━━━━━━━━━━━━━━━━━━━━━━━ auc 266 / 266 (00:05 < 00:00)
[8]:
expm.rna['integrated-metacell'].uns['tf.adjacencies']
[8]:
| tf | target | importance | |
|---|---|---|---|
| 1244 | Ltf | Ngp | 1.225779e+01 |
| 1244 | Ltf | Abca13 | 9.880056e+00 |
| 1094 | Irf7 | Ifit1bl1 | 9.697832e+00 |
| 1244 | Ltf | Camp | 9.575884e+00 |
| 94 | Irf4 | Ccr7 | 9.397725e+00 |
| ... | ... | ... | ... |
| 1274 | Elf4 | Slc25a21 | 1.083091e-19 |
| 292 | Ezr | Prg2 | 5.567626e-20 |
| 906 | Mrps25 | Slc25a21 | 4.510558e-20 |
| 781 | Lcorl | Prg2 | 2.973287e-20 |
| 719 | Sfpq | Usf3 | 2.380551e-20 |
997664 rows × 3 columns
[10]:
expm.rna['integrated-metacell'].obsm['tf'].iloc[:, 0:6]
[10]:
| regulon | Ahr (+) | Arid3a (+) | Arid5b (+) | Arntl (+) | Atf1 (+) | Atf2 (+) |
|---|---|---|---|---|---|---|
| mc:integrated:1 | 0.022785 | 0.041407 | 0.137302 | 0.000000 | 0.041860 | 0.032423 |
| mc:integrated:2 | 0.041360 | 0.091019 | 0.081349 | 0.000000 | 0.069738 | 0.025587 |
| mc:integrated:3 | 0.010312 | 0.029286 | 0.111905 | 0.000000 | 0.047406 | 0.032212 |
| mc:integrated:4 | 0.032939 | 0.067835 | 0.130159 | 0.000000 | 0.085915 | 0.072000 |
| mc:integrated:5 | 0.052145 | 0.078238 | 0.073810 | 0.000000 | 0.076212 | 0.030032 |
| ... | ... | ... | ... | ... | ... | ... |
| mc:integrated:1273 | 0.040842 | 0.084477 | 0.263889 | 0.000000 | 0.057523 | 0.013037 |
| mc:integrated:1274 | 0.075650 | 0.068866 | 0.194444 | 0.000000 | 0.087294 | 0.048021 |
| mc:integrated:1275 | 0.025464 | 0.106507 | 0.127513 | 0.014932 | 0.061451 | 0.029122 |
| mc:integrated:1276 | 0.041945 | 0.065663 | 0.160053 | 0.000000 | 0.077026 | 0.027894 |
| mc:integrated:1277 | 0.023798 | 0.029643 | 0.108598 | 0.000000 | 0.056603 | 0.028339 |
1277 rows × 6 columns
[24]:
fig = expm.rna.plot_multiple_embedding(
    run_on_samples = ['integrated-metacell'],
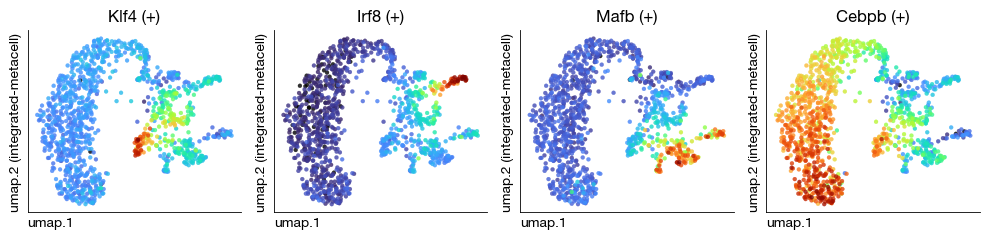
    basis = 'umap', features = ['Klf4 (+)', 'Irf8 (+)', 'Mafb (+)', 'Cebpb (+)'], ncols = 4,
    sort = True, figsize = (10, 2.5), dpi = 100, legend_col = 2
)
[25]:
em.memory()
[i] resident memory: 4.40 GiB
[i] virtual memory: 20.30 GiB
[ ]:
expm.save()